


SEO ROI for SaaS: How to Calculate It and Defend The Number
Table of Contents
SEO ROI for SaaS is net profit from organic search divided by the fully loaded cost of the program. Spend $211,000 in a year, attribute $252,000 of closed revenue to organic at a 78% gross margin, and the return is negative six percent, not the triple-digit figure the category advertises.
That gap is not an accounting error. It is the difference between measuring SEO ROI the way a CFO would and measuring it the way an agency case study does. The inputs are the same. The margin treatment, the attribution window and the choice of break-even are not, and each one moves the answer by more than the arithmetic does.
This article covers the formula, what belongs on the cost side, how to attribute revenue across a six to eighteen month cycle, how to test whether organic created demand or captured it, and what the most-cited SaaS benchmark requires to be true.
What SEO ROI Means for a SaaS Business
SEO ROI is the net profit generated by organic search over a defined period, divided by everything the program cost across that same period, expressed as a percentage. It answers one question: did the organic channel return more than it consumed?
SEO ROI = (Profit from organic search − Program cost) ÷ Program cost × 100
Both halves need the same window, and both need to be honest. Most published SEO ROI figures fail on the second condition rather than the first.
In SaaS the metric behaves differently than it does in e-commerce, and the difference is not cosmetic. An e-commerce sale closes in one session and settles in one payment. A SaaS sale closes over quarters, settles monthly, and keeps settling for as long as the customer stays. Those two properties pull SEO ROI in opposite directions: the long cycle makes attribution harder and the recurring revenue makes the eventual return larger. Any figure that captures one and ignores the other is describing something other than the business.
The metric exists to inform a budget decision, so it has to be built to survive the conversation where that budget is defended. A number that cannot be reconstructed from its inputs will not survive it.
The SEO ROI Formula
The arithmetic is trivial. Three inputs carry all the weight.
Revenue attributed to organic. Not sessions, not leads, not marketing qualified leads. Closed revenue, connected to organic touchpoints through the CRM. How much you attribute depends on the model you pick, which is the subject of its own section below.
Margin. Revenue is not profit. A SaaS business running a 78% gross margin keeps 78 cents of each attributed dollar before any sales cost. Dividing revenue by cost instead of profit by cost inflates the result by the inverse of the margin, and it is the single most common inflation in published figures.
Cost. Everything the program consumed, which is almost never the invoice alone.
Get all three right and the calculation is a line of arithmetic. Get one wrong and the output can be off by a multiple, not a margin of error.
The reconstruction test: if someone in the room cannot rebuild your SEO ROI figure from the inputs on the slide, the figure is a claim, not a measurement. Publish the inputs or do not publish the number.
What Belongs on The Cost Side
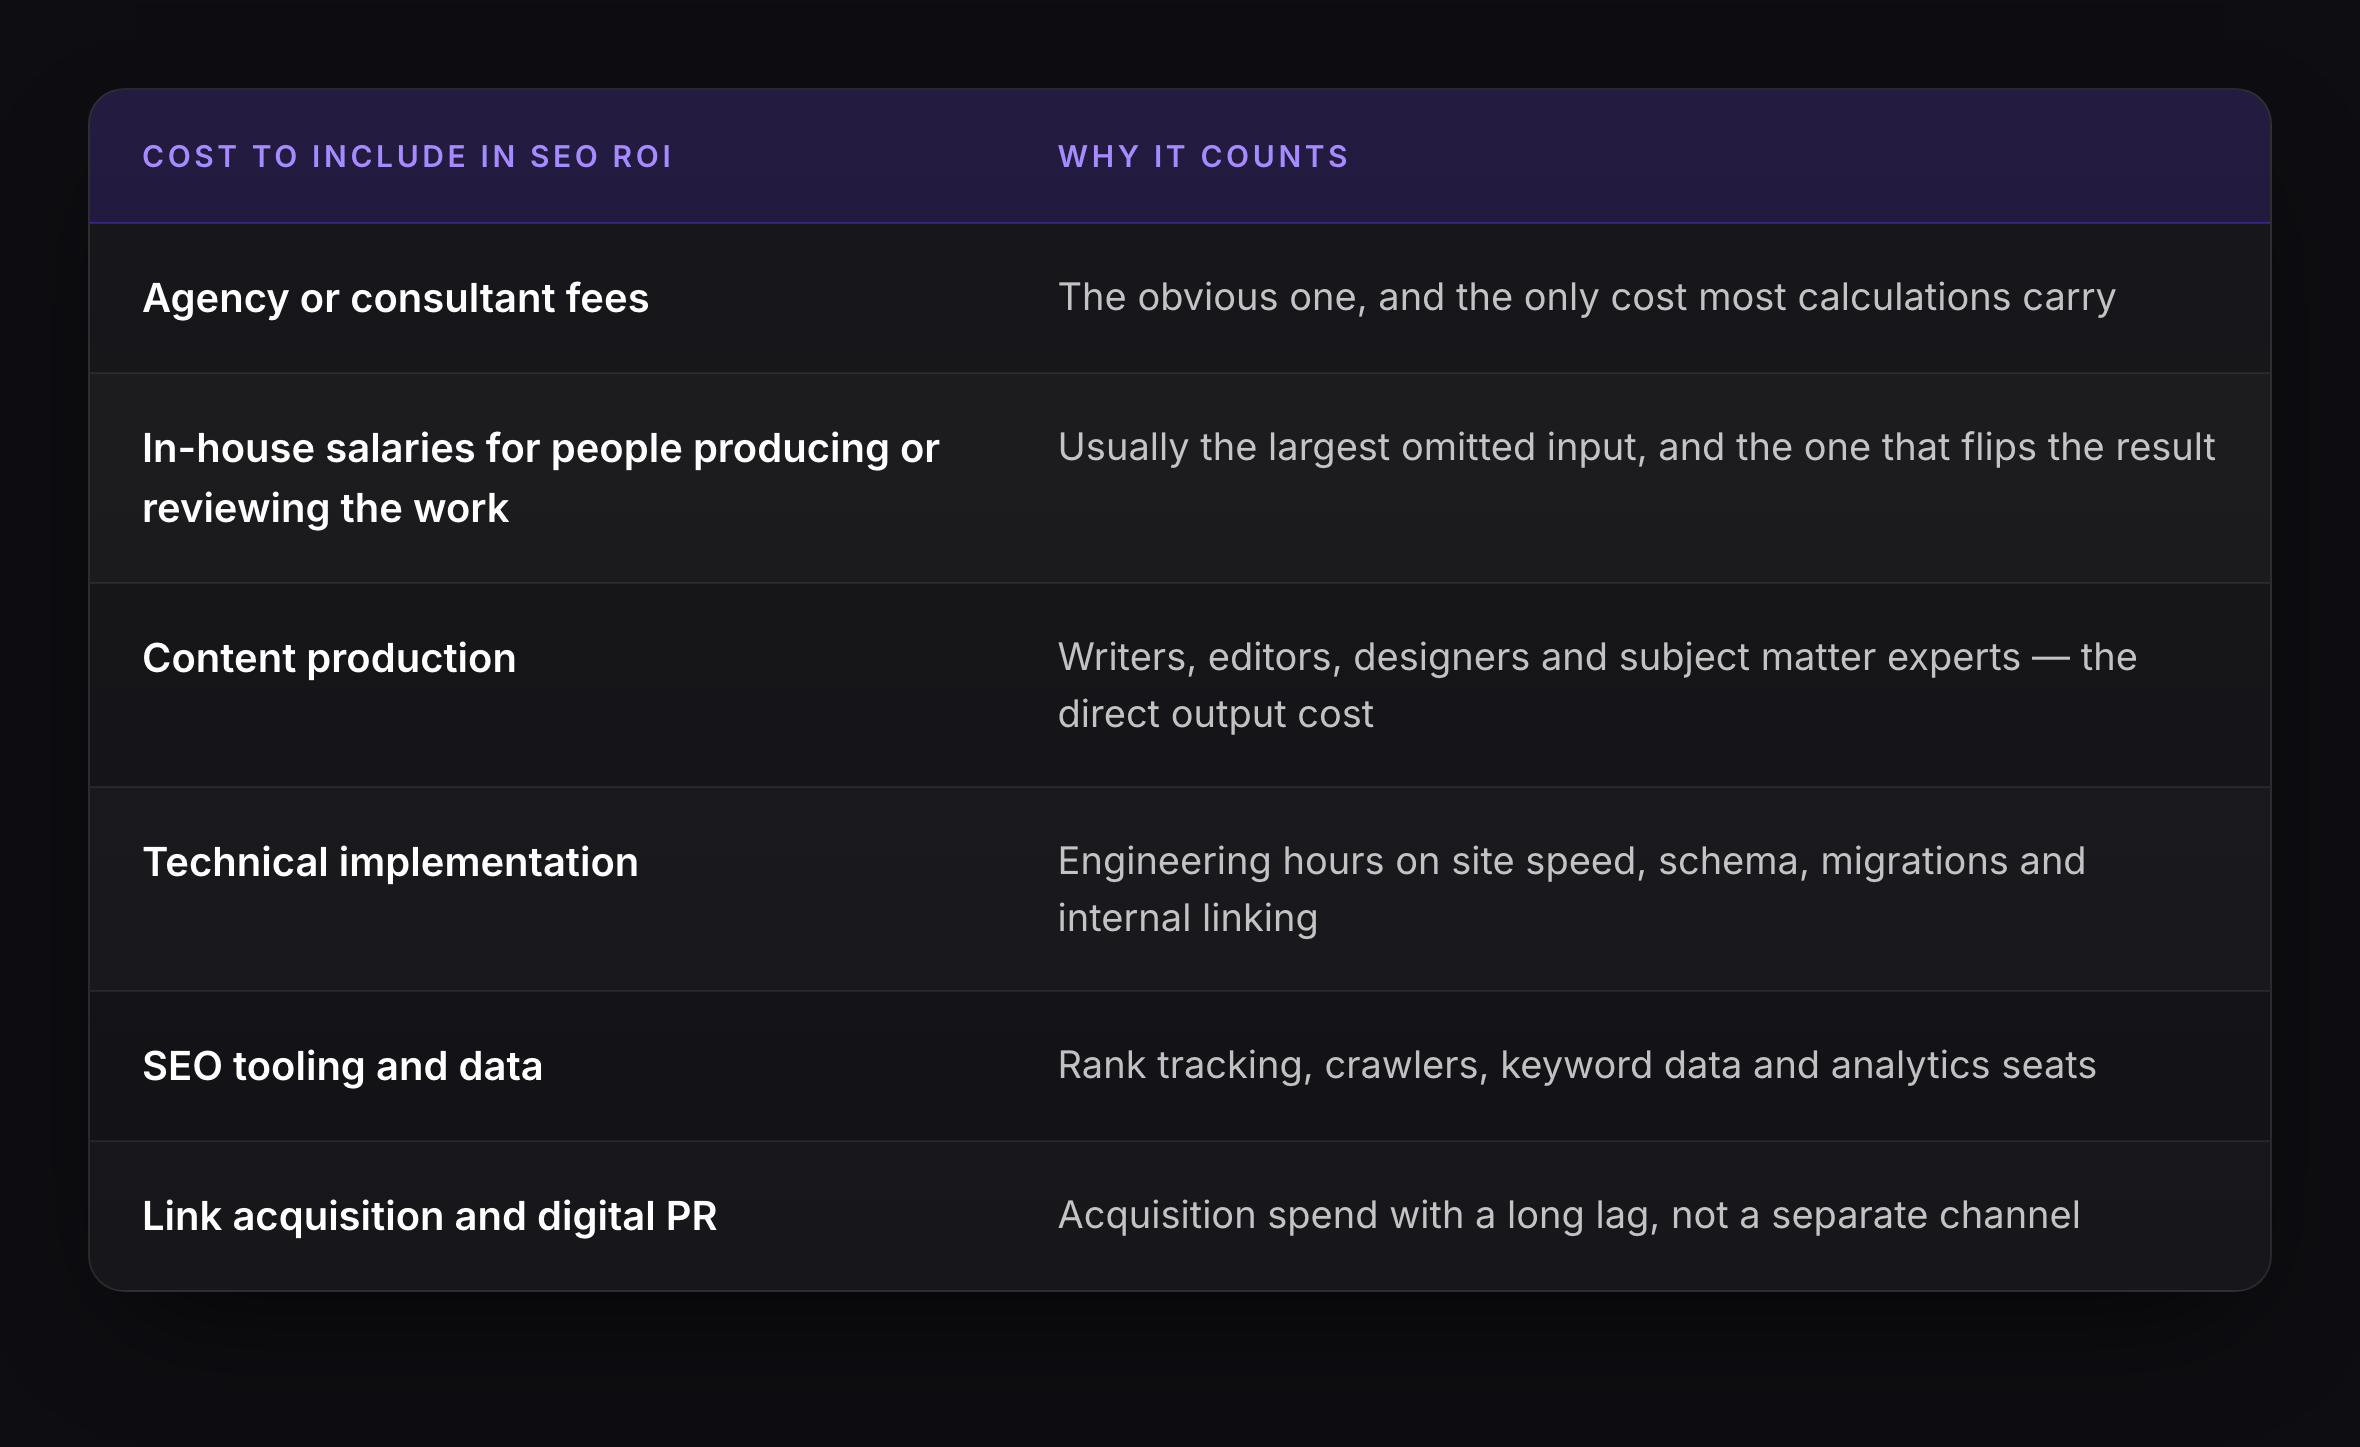
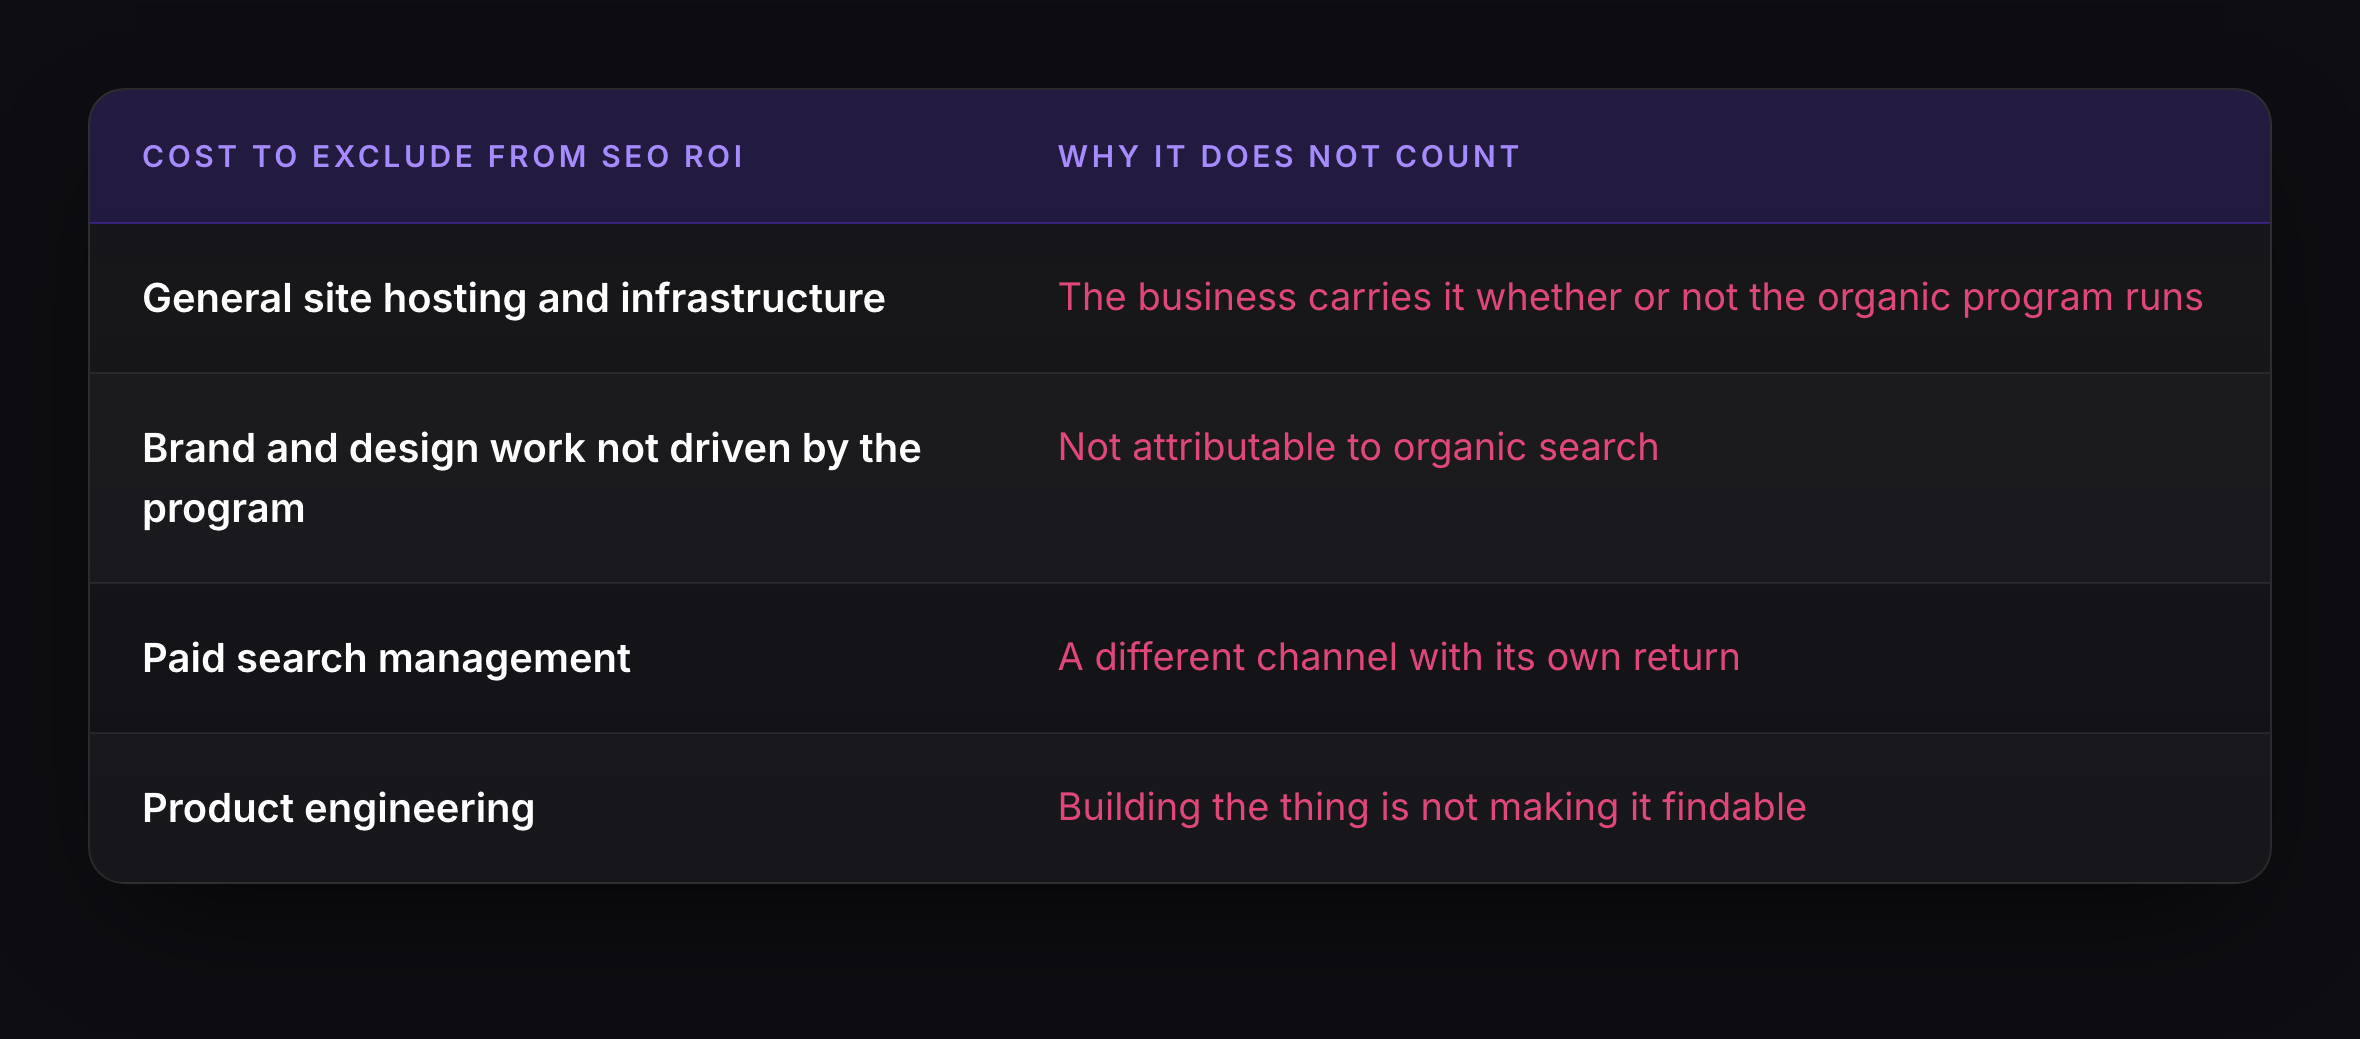
The invoice is the visible part of the cost and usually the smaller part.
Include
Exclude
The Costs That Cause Arguments
Executive and founder time. If a founder spends four hours a week reviewing content and briefing the agency, that is a real cost. Leaving it out is why in-house SEO ROI often looks better than agency-run SEO ROI on identical output.
Content written by subject matter experts who do other jobs. The hour a solutions engineer spends on a technical post is an hour not spent on their own work. Cost it at their loaded rate.
Technical debt paid down by the program. A site migration that improves crawlability also improves the product experience. Split it, or assign it and say you did.
The test: if you stopped the organic program tomorrow, would this cost fall? If yes, it belongs in the SEO ROI calculation. Apply it to anything not listed above and you will get a defensible answer.
That test is the same one that governs customer acquisition cost, and for the same reason. SEO ROI and CAC are two views of the same spend.
The Measurement Infrastructure SEO ROI Assumes You Have
Most SEO ROI calculations fail before the arithmetic, in the data layer. The formula assumes a join between an organic session and a closed deal that most SaaS stacks cannot actually make.
Four things have to be true before an SEO ROI figure means anything.
Source is captured at the point of conversion and persisted. A hidden field on every form that writes the landing page, referrer and first-touch channel into the CRM record. Not recomputed later in the analytics tool, where it will be re-attributed by whatever model is active that quarter. Written once, to the contact, and never overwritten.
First touch and last touch are both stored on the record. Storing one and deriving the other is how programs end up reporting whichever number the tool defaults to. Two fields, both populated, both auditable.
Closed-won status returns to the analytics layer. Offline conversion import, or a CRM-side report that carries channel through to revenue. Without it, the organic funnel is measured to the demo request and guessed at thereafter. That is exactly where the SEO ROI figure quietly becomes a lead-cost figure wearing a revenue label.
Branded and non-branded organic are separated and stay separated. Search Console supplies the query split; the CRM has to carry it far enough downstream to survive into the ROI calculation. This single split is what makes the incrementality test below possible at all.
One default worth knowing about. GA4's attribution lookback tops out well short of a long enterprise sales cycle. If your cycle runs fourteen months and the lookback covers three, the first organic touch that created the deal is invisible to the tool by the time the deal closes, and the SEO ROI you calculate from it will be structurally understated. Set the lookback to its maximum, then treat the CRM rather than the analytics tool as the system of record.
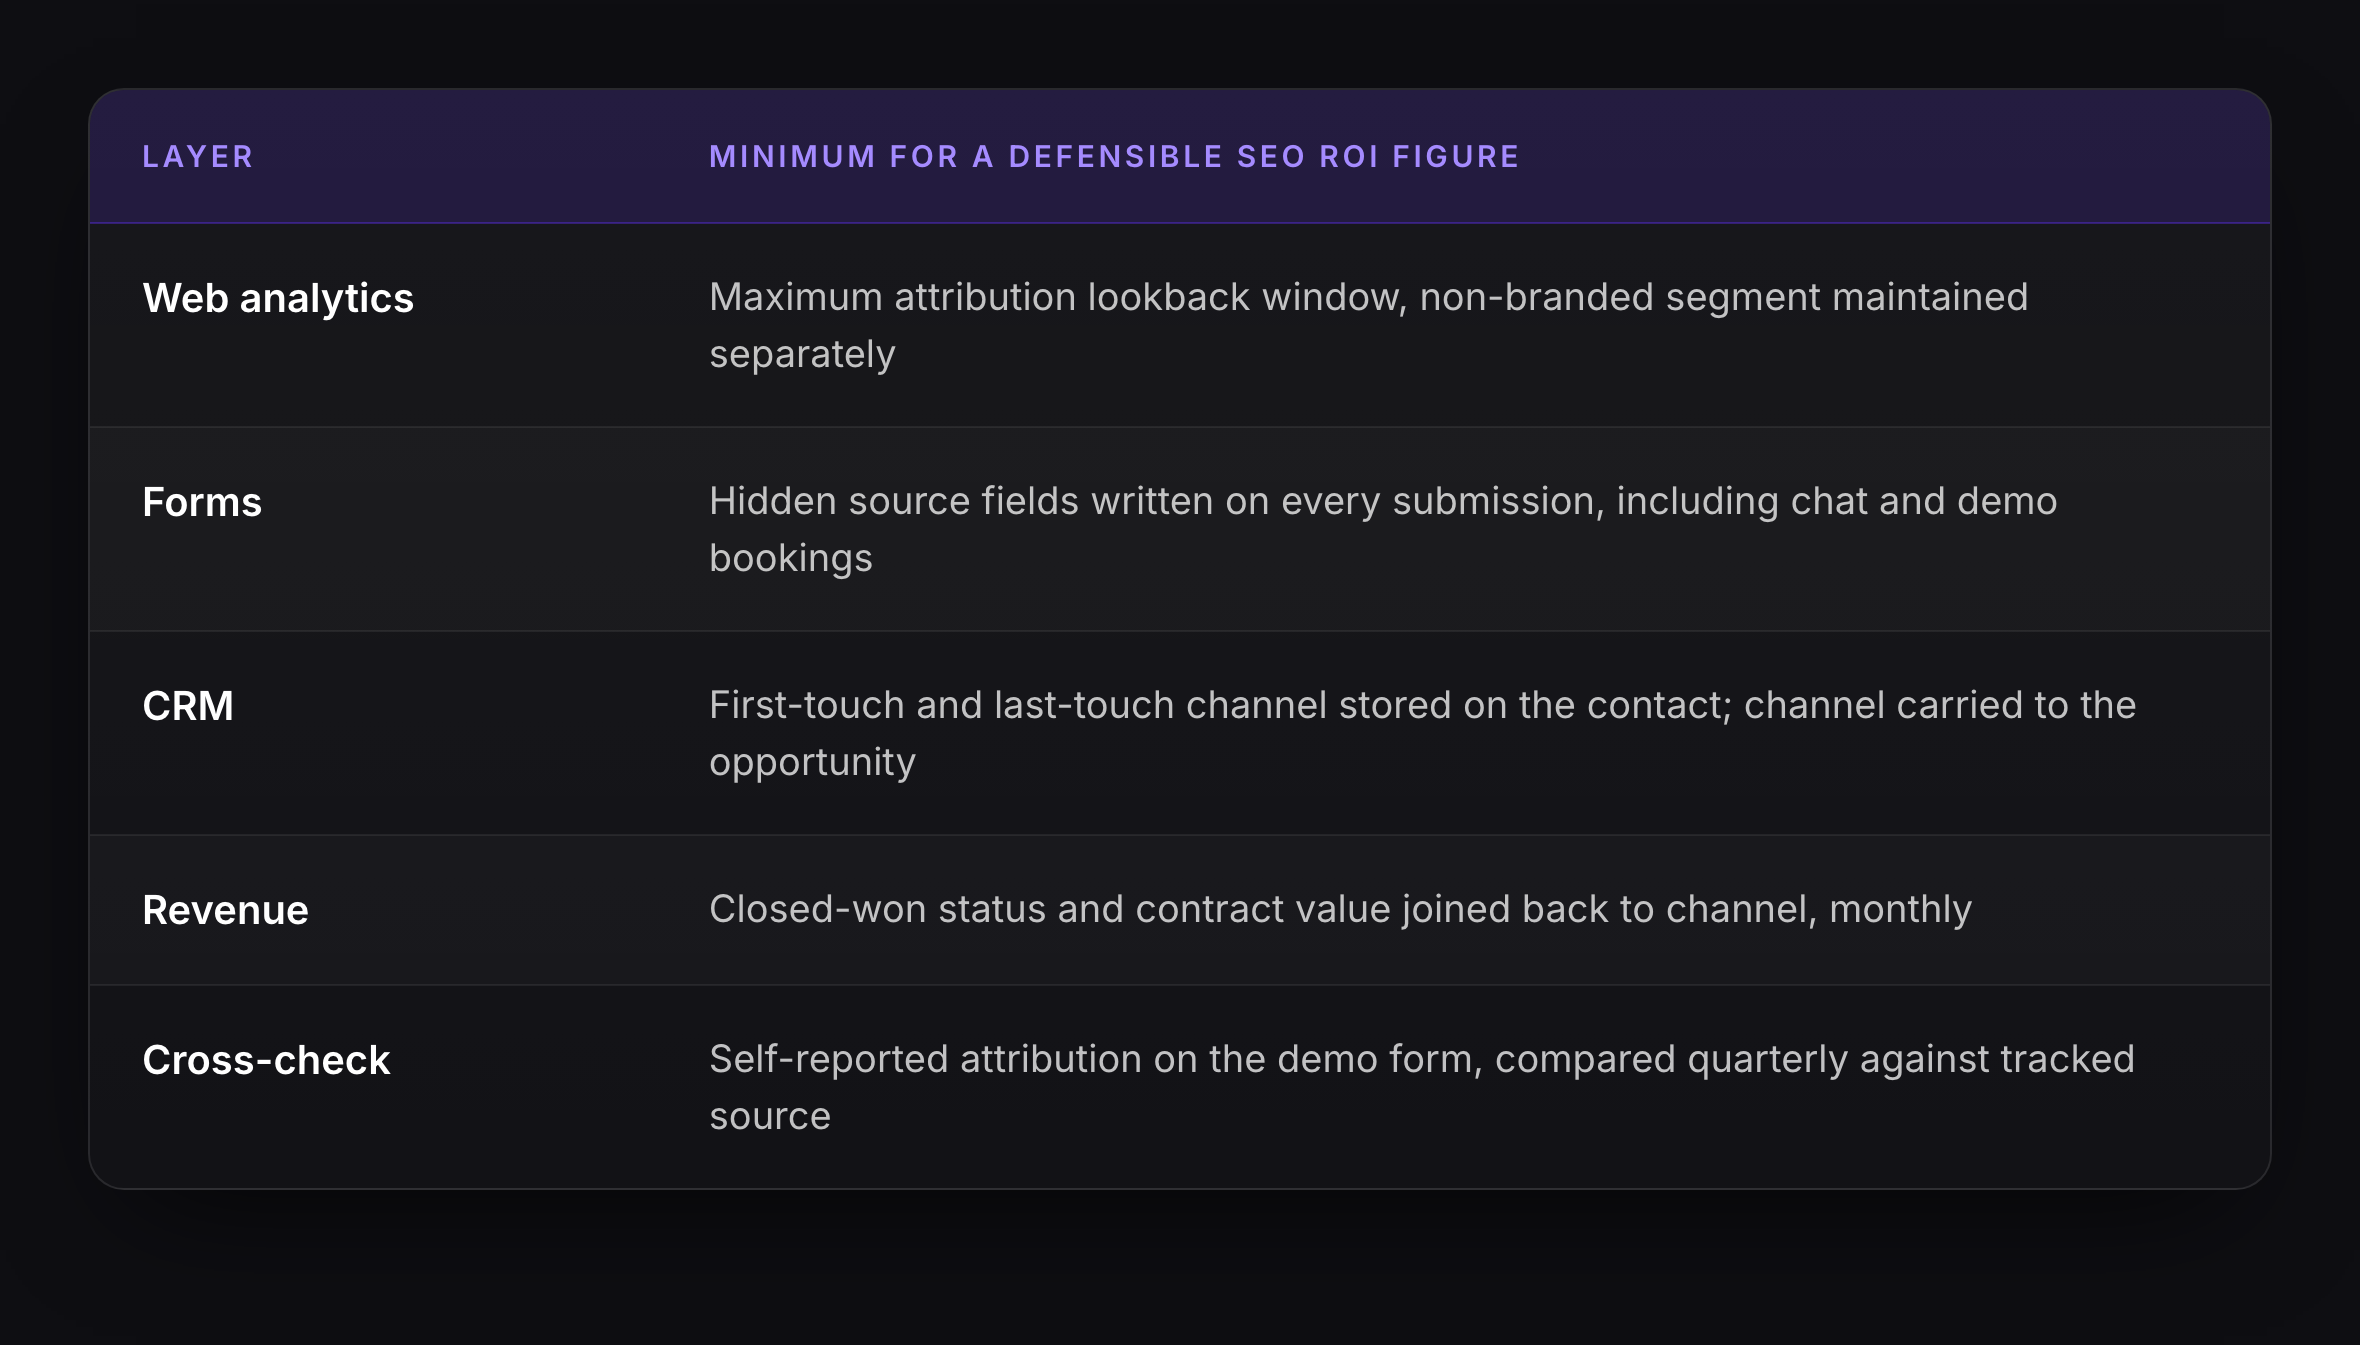
That last row does more work than its cost suggests. When "how did you hear about us" and the tracked source disagree consistently in one direction, the tracking is wrong and the SEO ROI built on it is wrong by the same amount.
Attributing Revenue Across a Six to Eighteen Month Cycle
This is where SaaS breaks the models that work elsewhere.
A B2B SaaS buyer reads a comparison post in March, downloads nothing, returns through a branded search in July, books a demo from a link in a colleague's Slack message in September, and signs in November. Organic search touched that deal twice. Neither touch was the last one.
Four attribution models are in common use, and each answers a different question.
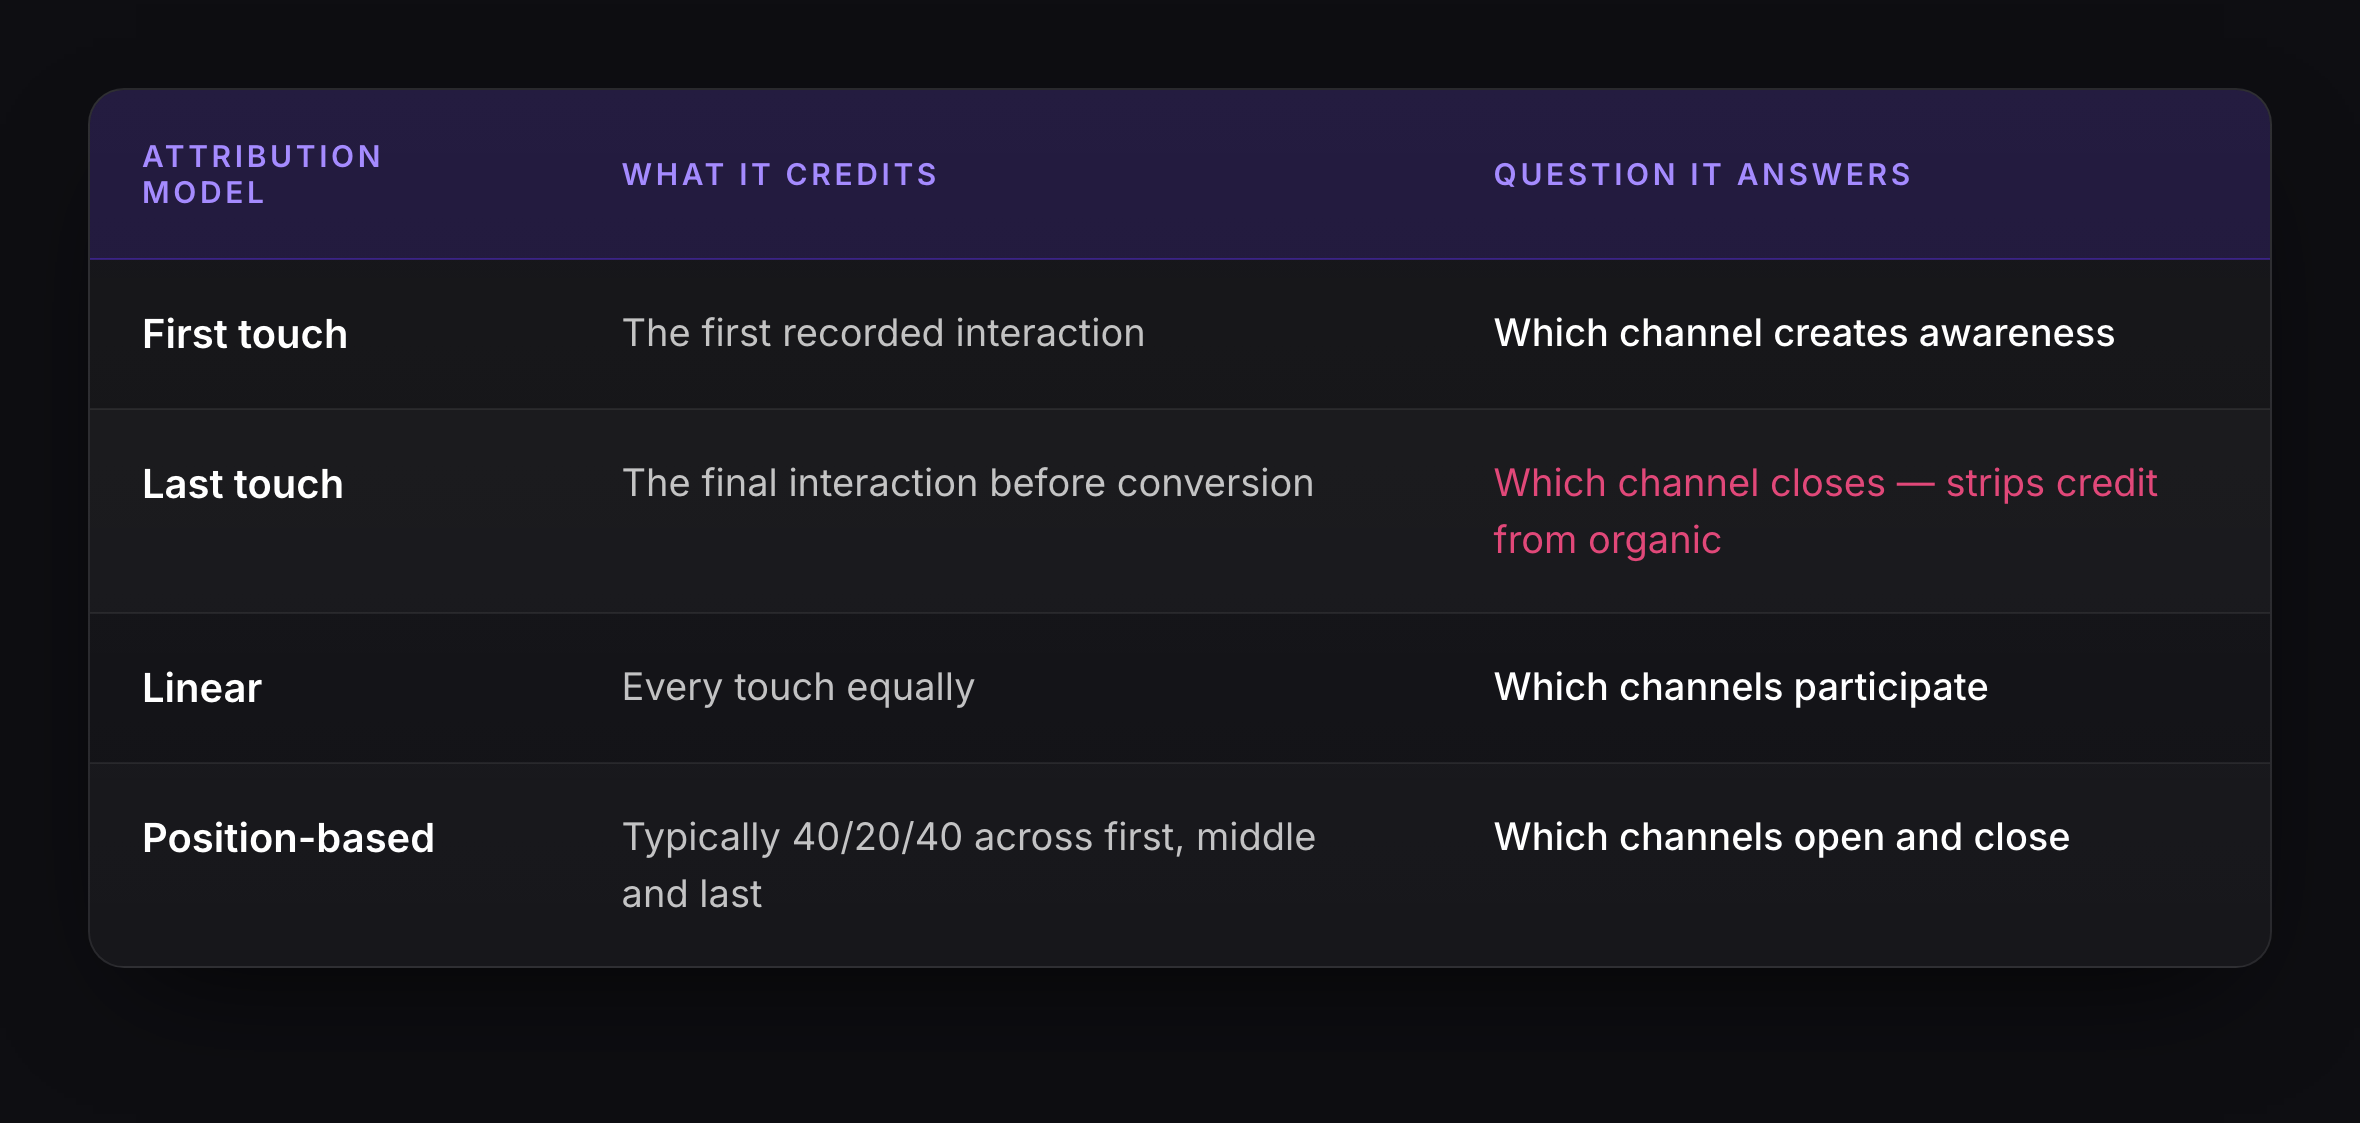
For SEO ROI in SaaS, first touch and position-based are the only two that produce a figure worth reporting. Last touch systematically strips credit from organic, because organic rarely closes. It is read early, and the demo request that closes usually comes from a branded search or a direct visit months later.
Sourced against influenced. Sourced pipeline is where organic was the first recorded touch. Influenced pipeline is any deal where organic appeared anywhere in the journey. In a long cycle the second number is often two to three times the first.
Reporting only sourced understates the channel. Reporting only influenced overstates it, because a single blog visit in month one did not close a six-figure deal in month fourteen. The defensible practice is to publish both, show the overlap, and apply a stated credit weight to influenced-only deals rather than counting them whole.
The weight is a judgment. Making it explicit is what separates a measurement from a marketing figure.
The Incrementality Test
Every SEO ROI calculation published in this category shares one flaw: it credits the program with revenue that would have arrived anyway.
A prospect who already knows your brand, searches your company name, lands on your site and converts is recorded as organic. They are organic in the analytics sense and not in the causal sense. The program did not create that demand. It captured demand created somewhere else: a conference, a podcast, a competitor's failure, a colleague's recommendation.
Splitting the two is the difference between a figure that justifies the budget and a figure that merely describes traffic.
The practical test, in three steps:
- Segment branded from non-branded organic. Branded queries are demand capture. Non-branded queries are, mostly, demand creation. Run the ROI calculation on non-branded alone and see what survives.
- Establish a pre-program baseline. What did organic deliver in the four quarters before the program started? That volume is the floor. Revenue below the floor is not the program's achievement.
- Hold out something. A set of pages, a product line, a geography left untouched for two quarters gives a comparison that no attribution model can provide. It costs growth in the holdout and it is the only method here that approaches evidence.
Most teams will not run a holdout, and that is a reasonable commercial decision. What is not reasonable is reporting a return as though incrementality had been established when it has not been.
The size of the correction surprises people the first time they run it. In a business with any brand presence at all, branded queries routinely account for a third to a half of organic conversions, and every one of them lands in the SEO ROI calculation as though the program produced it. Strip them and a comfortable figure often turns marginal, which is uncomfortable and correct.
There is a second-order effect worth naming, because stripping branded search entirely has its own distortion. Content programs do create branded demand: someone reads three posts, remembers the company, and searches the name six weeks later. That conversion is branded by the time it is recorded, and the program did cause it. Perfect separation is not available. What is available is reporting the SEO ROI both ways — branded included and branded stripped — and treating the honest answer as the range between them rather than a point.
What the Published Benchmarks Actually Require to Be True
The most cited SaaS SEO benchmark in circulation is 702%. It comes from First Page Sage's SEO ROI Statistics 2026 report, published September 2025 and last updated December 2025, and it is drawn from the firm's own client campaigns run between Q1 2021 and Q3 2025. Competitors writing about SEO ROI cite it and move on.
It is worth not moving on, because the report publishes enough for the figure to be examined.
The two headline numbers only reconcile at a 92% margin. The report gives both an ROI of 702% and a ROAS of 8.75. If net profit were simply revenue minus cost, those two numbers would be the same statement:
ROI = (Revenue − Cost) ÷ Cost = ROAS − 1
8.75 − 1 = 7.75  →  775%
775% is not 702%. Solving for the margin that makes the published pair agree:
(8.75 × m) − 1 = 7.02
m = 8.02 ÷ 8.75 = 0.917
The figures reconcile at a profit margin of roughly 92%. That is our derivation, not the report's statement. The report does not disclose a margin assumption anywhere. But it means a reader running a 75% gross margin, which is ordinary for B2B SaaS, cannot apply 702% to their own business without adjusting it down by roughly a fifth before examining anything else.
The volume the figure requires. The report defines cost as "what a company pays our agency (~$120,000 / year) plus a share of the salary of all the people interacting with our firm on the client side," averaged over three years, with the stated condition that customer lifetime value is "$10,000+."
Take only the disclosed agency fee:

Add even a quarter of a full-time employee on the client side, which the report's own cost definition calls for, and the base rises to $450,000 and the requirement to roughly 394 customers.
None of that is impossible. It describes a company with a working funnel, a $10,000-plus lifetime value and a $120,000-a-year program sustained for three years. It does not describe the median SaaS business reading the statistic and deciding what to budget.
The report is not dishonest. It is a vendor publishing its own client outcomes under stated conditions, which is more than most of the category does. The error belongs to everyone who repeats the number without the conditions attached.
Two Break-Evens, and Which One Your CFO Means
The same report puts break-even at seven months. Seven months of the disclosed fee is $70,000, which means booking roughly 7.6 customers at $10,000 lifetime value by month seven.
Lifetime value does not arrive by month seven. It arrives over the customer's lifetime, which in SaaS is typically two to three years of monthly payments. The figure sets booked lifetime value against cash already spent.
That is a legitimate way to measure. It is simply not the same measurement as cash covering cash, and the two answers can be a year apart.
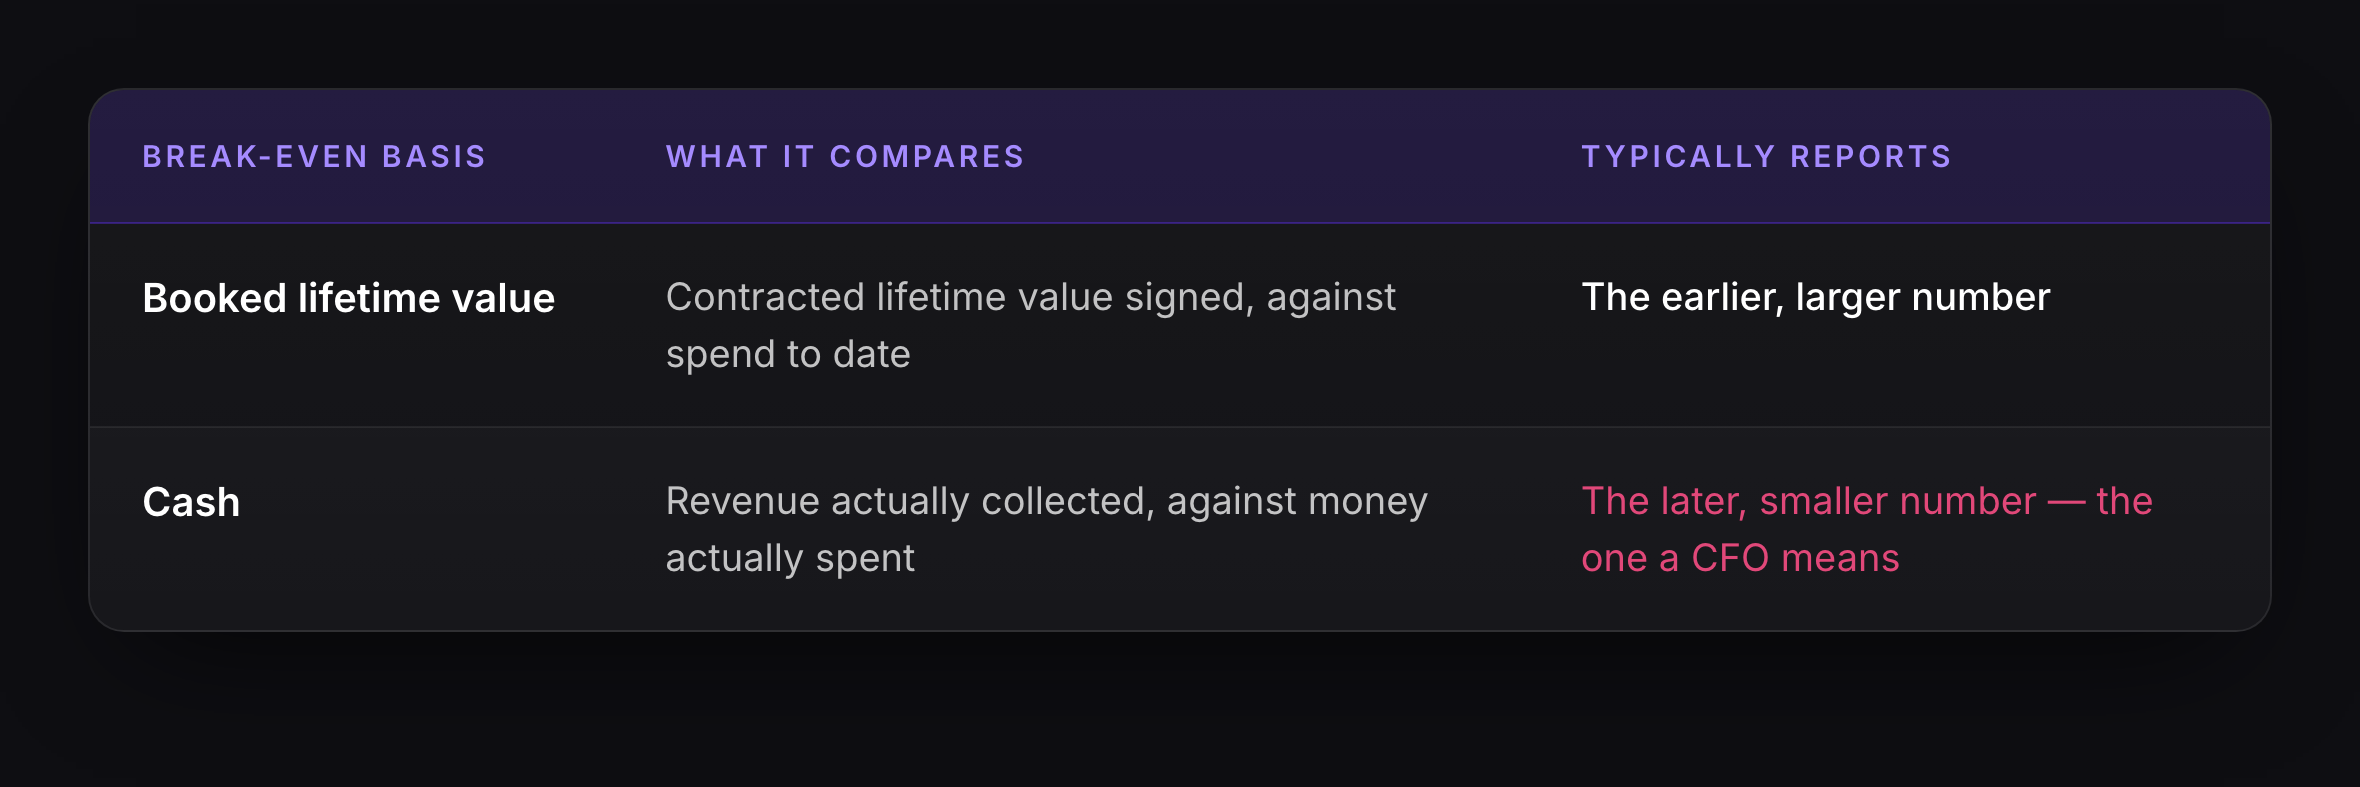
Both are true. A CFO asking when SEO pays for itself is asking the second question, almost always. The gap between the two break-evens is not a rounding difference either: on a subscription billed monthly against a lifetime measured in years, the booked figure can cross into profit three or four quarters before the collected one does. Anyone comparing a booked SEO ROI from one vendor against a cash SEO ROI from another is comparing two different businesses. Report both, label which is which, and the conversation stops being an argument about whether the number is real.
Worked Example: One Program, 5 ROI Figures
The following is a model, not a client account. Every figure is reproducible from the inputs.
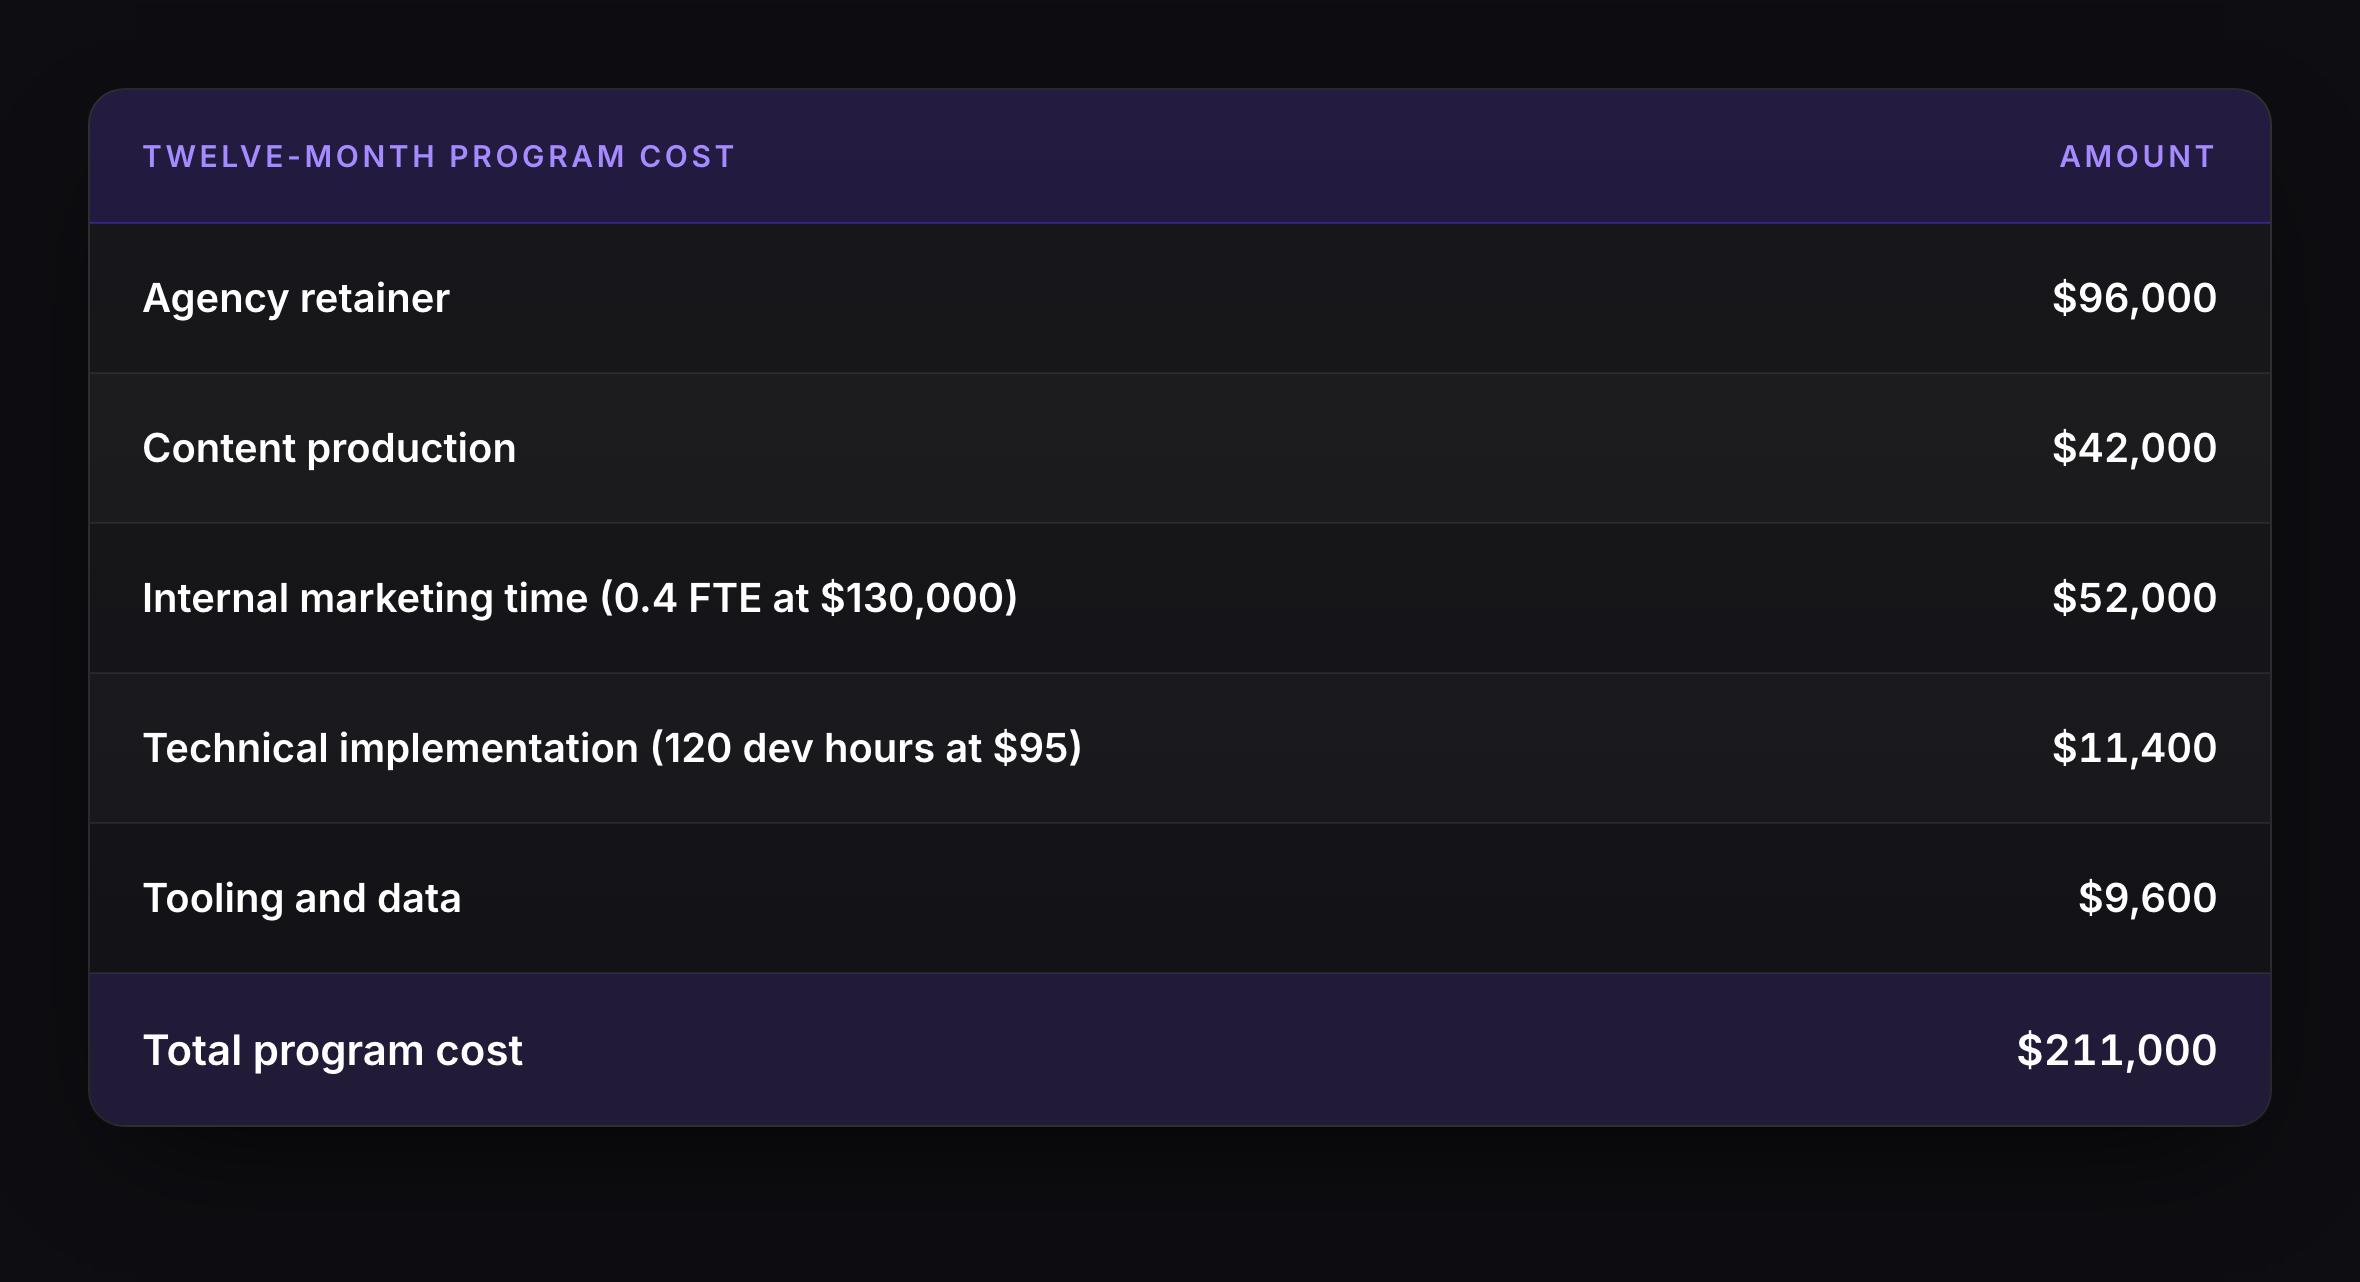
The Program, 1 Year
The Outcome, 1 Year
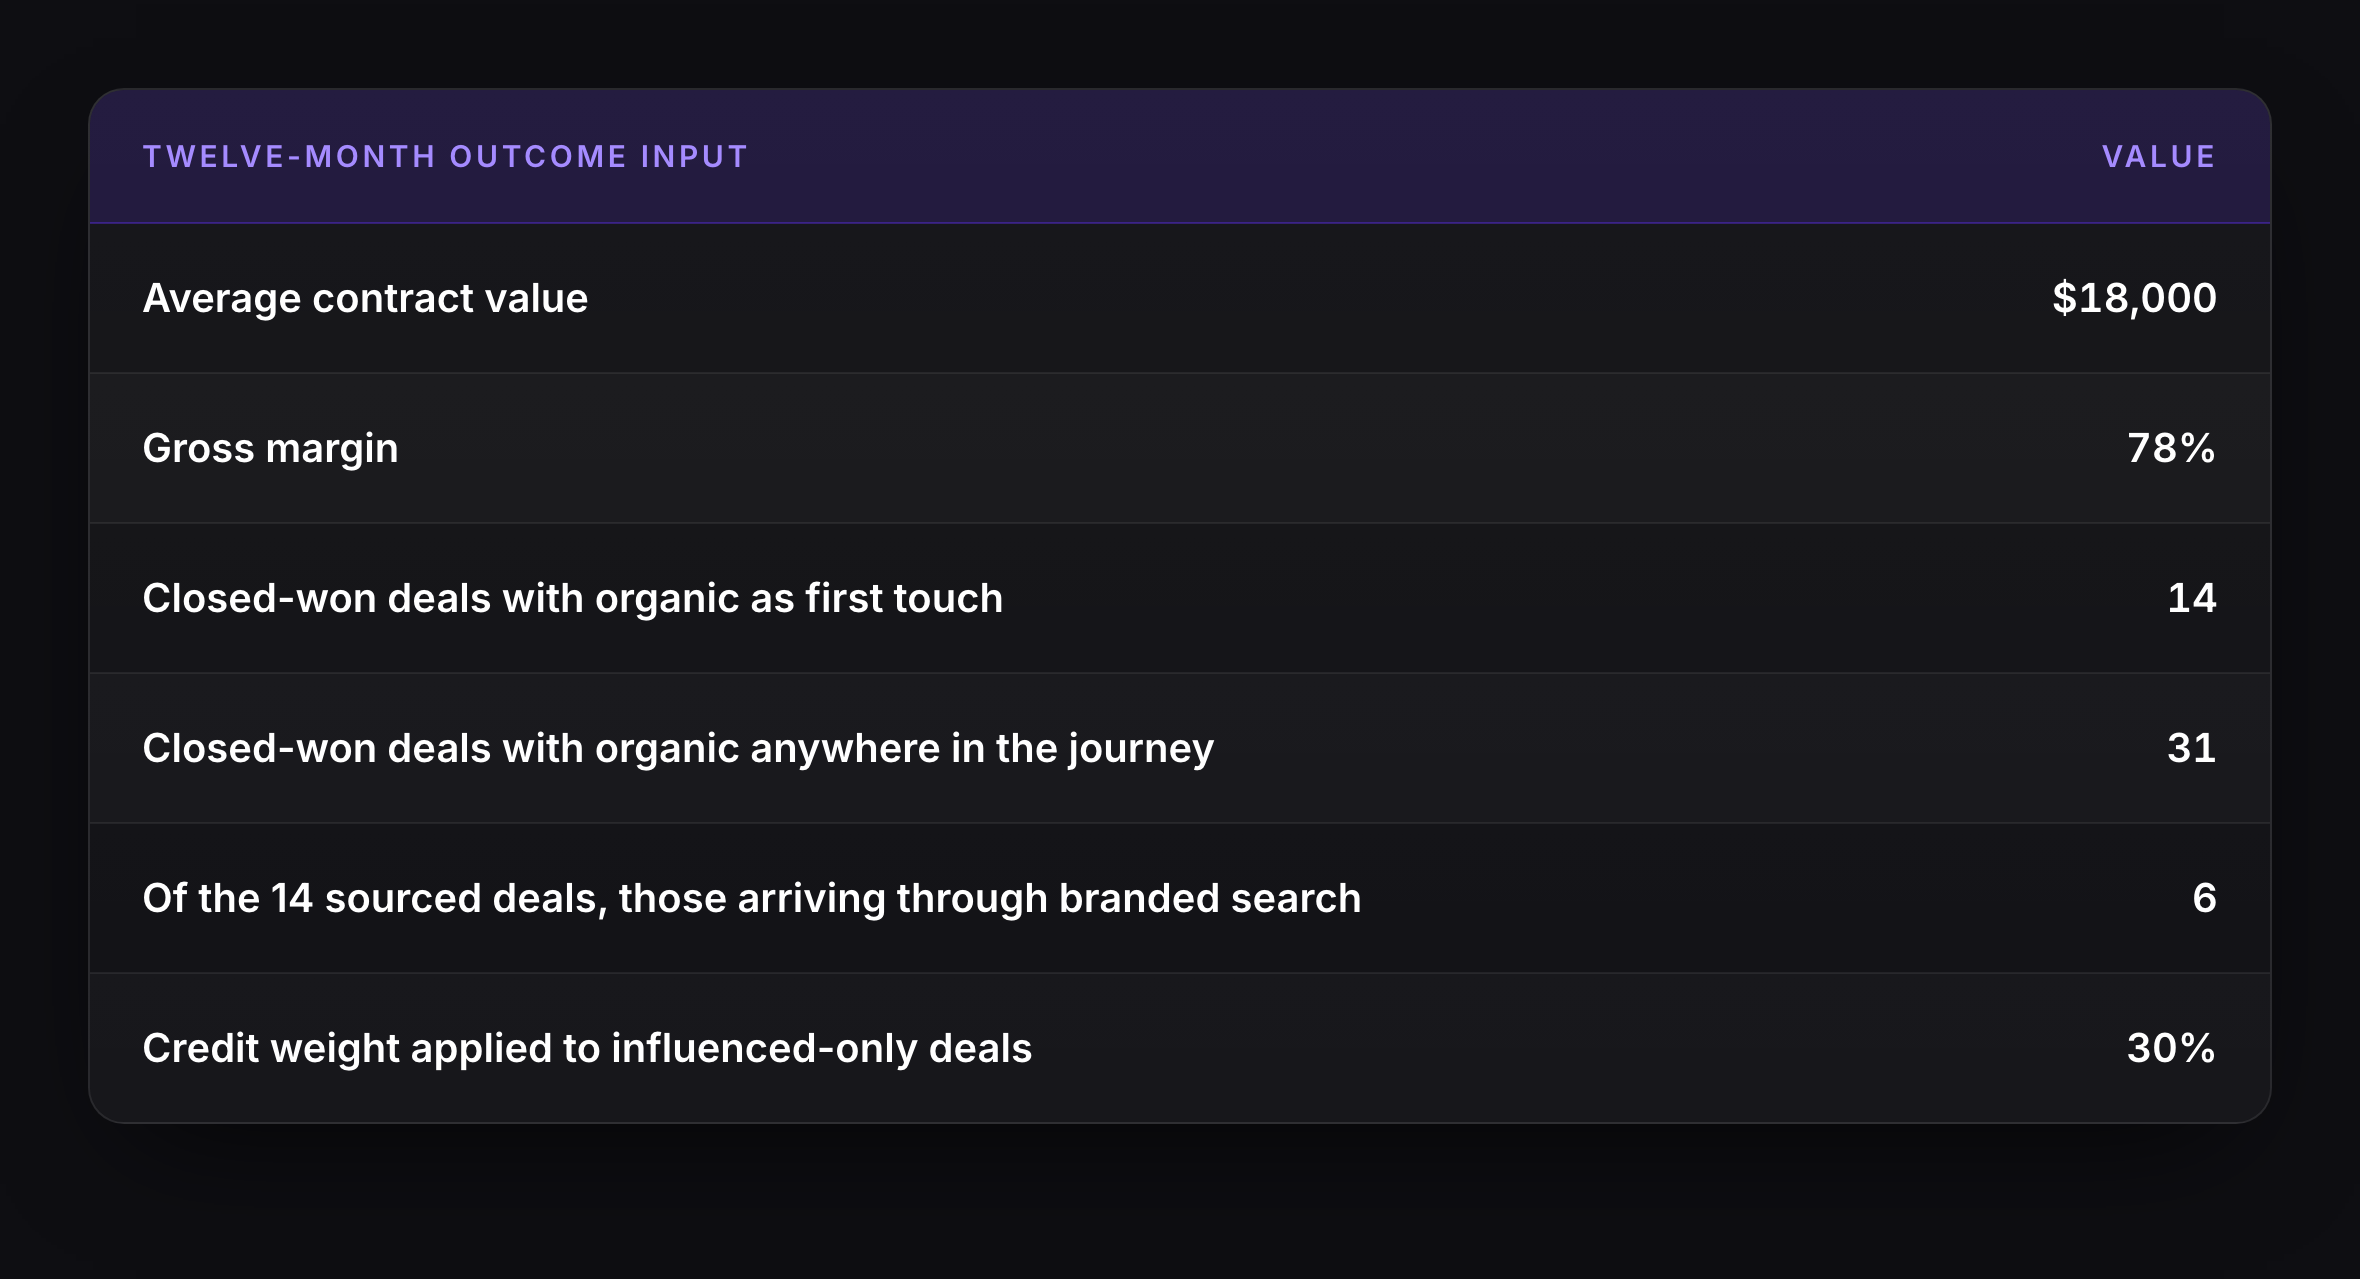
Figure one: sourced only. 14 × $18,000 = $252,000 attributed revenue. At 78% margin, $196,560 of profit contribution against $211,000 of cost.
($196,560 − $211,000) ÷ $211,000 × 100 = −6.8%
Figure two: sourced plus weighted influence. Seventeen deals were influenced but not sourced. At a 30% credit weight: 17 × $18,000 × 0.30 = $91,800, plus the $252,000 sourced, gives $343,800. At 78% margin, $268,164.
($268,164 − $211,000) ÷ $211,000 × 100 = 27.1%
Figure three: incremental. Strip the six branded-search deals, which the program captured rather than created. Eight sourced deals at $18,000 is $144,000, plus the $91,800 of weighted influence, gives $235,800. At 78% margin, $183,924.
($183,924 − $211,000) ÷ $211,000 × 100 = −12.8%
One program, one twelve-month window, three defensible numbers spanning forty points. Nobody in that range is lying. They are answering different questions.
Figure four: the same program at 36 months, cash basis. Content compounds, so assume sourced deals of 14, 26 and 38 across three years, at a flat $211,000 annual cost.
Cumulative cost      $633,000
Cumulative deals     78  →  78 × $18,000 = $1,404,000
At 78% margin        $1,095,120
ROI                  ($1,095,120 − $633,000) ÷ $633,000 × 100 = 73%
Figure five: the same 36 months on booked lifetime value. At an average retention of 30 months, each customer is worth 2.5 × $18,000 = $45,000 rather than one year's contract.
78 × $45,000 = $3,510,000
At 78% margin        $2,737,800
ROI                  ($2,737,800 − $633,000) ÷ $633,000 × 100 = 332%
Seventy-three percent and 332% describe the identical program over the identical period. The second is the number that appears in case studies. The first is the number that appears in the bank.
This is how a 702% gets built, and it is worth saying plainly: not by inventing anything, but by choosing the lifetime-value basis, a generous attribution model, a high margin and a three-year window, each defensible on its own, and compounding the four.
Forecasting SEO ROI Before the Data Exists
Every program needs a number before it has evidence. The forecast is not a measurement and should never be reported as one, but refusing to build it just means someone else builds a worse one.
The chain is short:
Monthly non-branded search demand
  × expected click-through rate at the target position
  × visitor-to-demo rate
  × demo-to-close rate
  × average contract value
  = new ACV booked per month
Run it on the same program from the worked example. Say the target keyword cluster carries 12,000 non-branded searches a month, and the realistic landing position is four to five, worth roughly an 8% click-through rate.
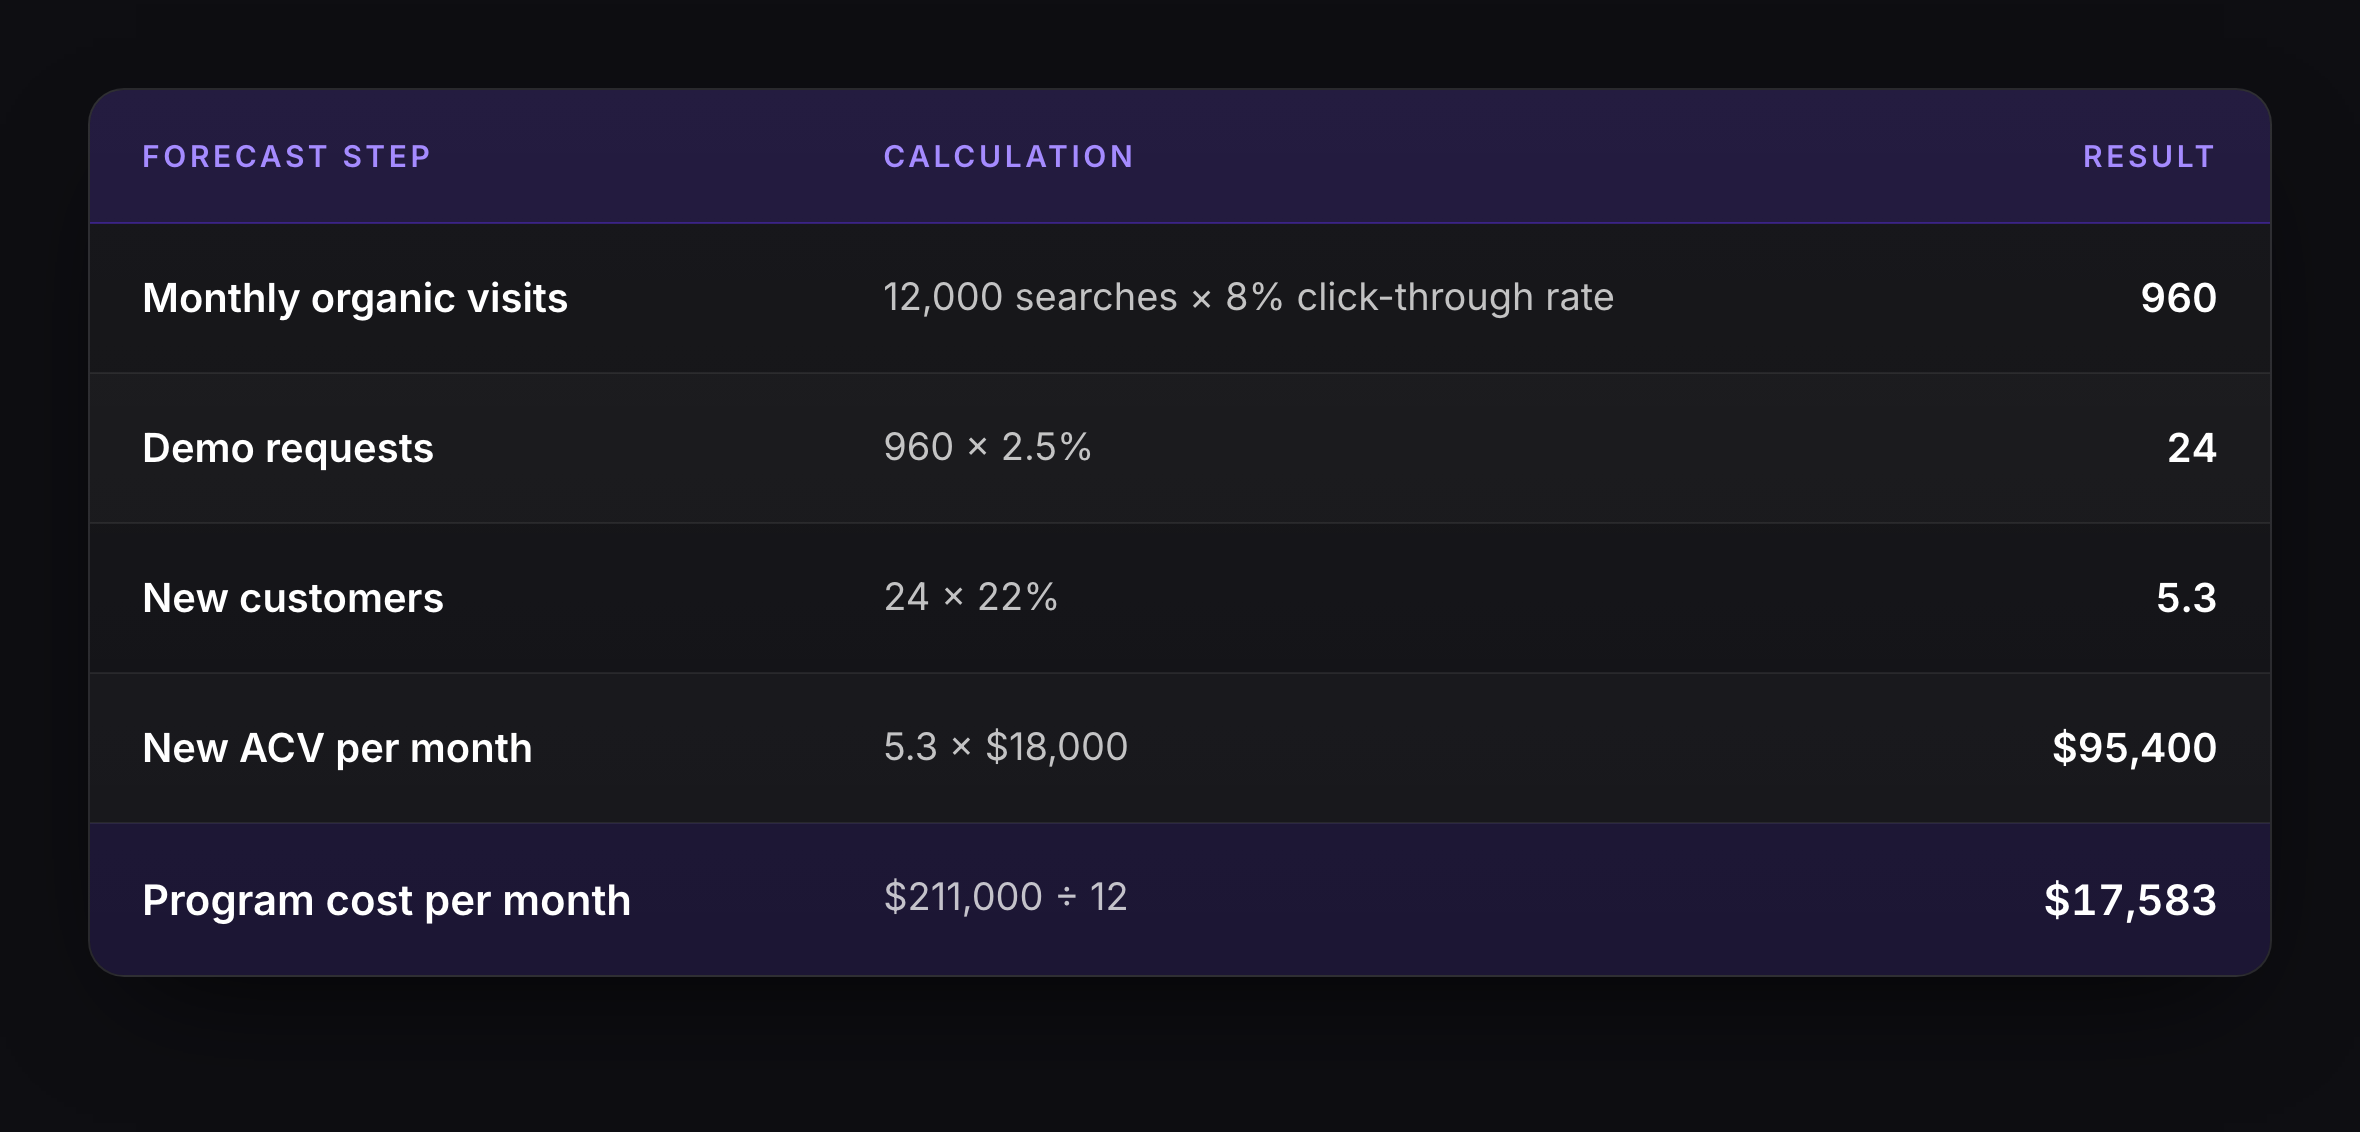
On those inputs the program returns more than five times its monthly cost, and a forecast like that is why SEO ROI projections are treated with suspicion. Three corrections make it usable.
Apply a ramp. Nothing ranks in month one. A defensible ramp is zero through month four, 30% of steady state in months five to eight, and 70% in months nine to twelve. Year one delivers roughly a third of the run rate, not the run rate.
Haircut the click-through rate and the close rate. Both are usually taken from the best-performing existing page and the best-performing existing channel. Use the blended figures instead, and the forecast falls by a quarter before anything else changes.
State the position assumption out loud. The entire forecast rests on reaching positions four to five for a cluster you do not currently rank for. If that assumption fails, every number downstream of it fails with it, and the forecast should say so on the same slide.
A forecast built this way will still be wrong. It will be wrong within a range you can defend, which is the only standard a forecast can meet.
Reporting SEO ROI: One Page, Three Audiences
An SEO ROI figure that lives in a 40-slide deck does not get used. The programs that keep their budget report on one page, quarterly, and give three audiences different rows of it.
The CFO gets the cash view. Fully loaded program cost for the quarter, revenue collected and attributable to organic, the resulting SEO ROI on a cash basis, and the cash payback date. One number, one basis, labelled. If booked lifetime value appears at all it appears underneath, marked as a different measurement, never as the headline.
The CMO gets the pipeline view. Sourced pipeline, influenced pipeline, the overlap between them, the credit weight applied, and the trend across the last four quarters. The trend matters more than the level here: a program moving from negative to positive is a different decision from one holding flat at a good number.
The team gets the leading indicators. Non-branded impressions and clicks, positions for the target cluster, pages published against plan, and the conversion rate of organic landing pages. None of these is SEO ROI. All of them move before it does, which is the only reason to look at them.
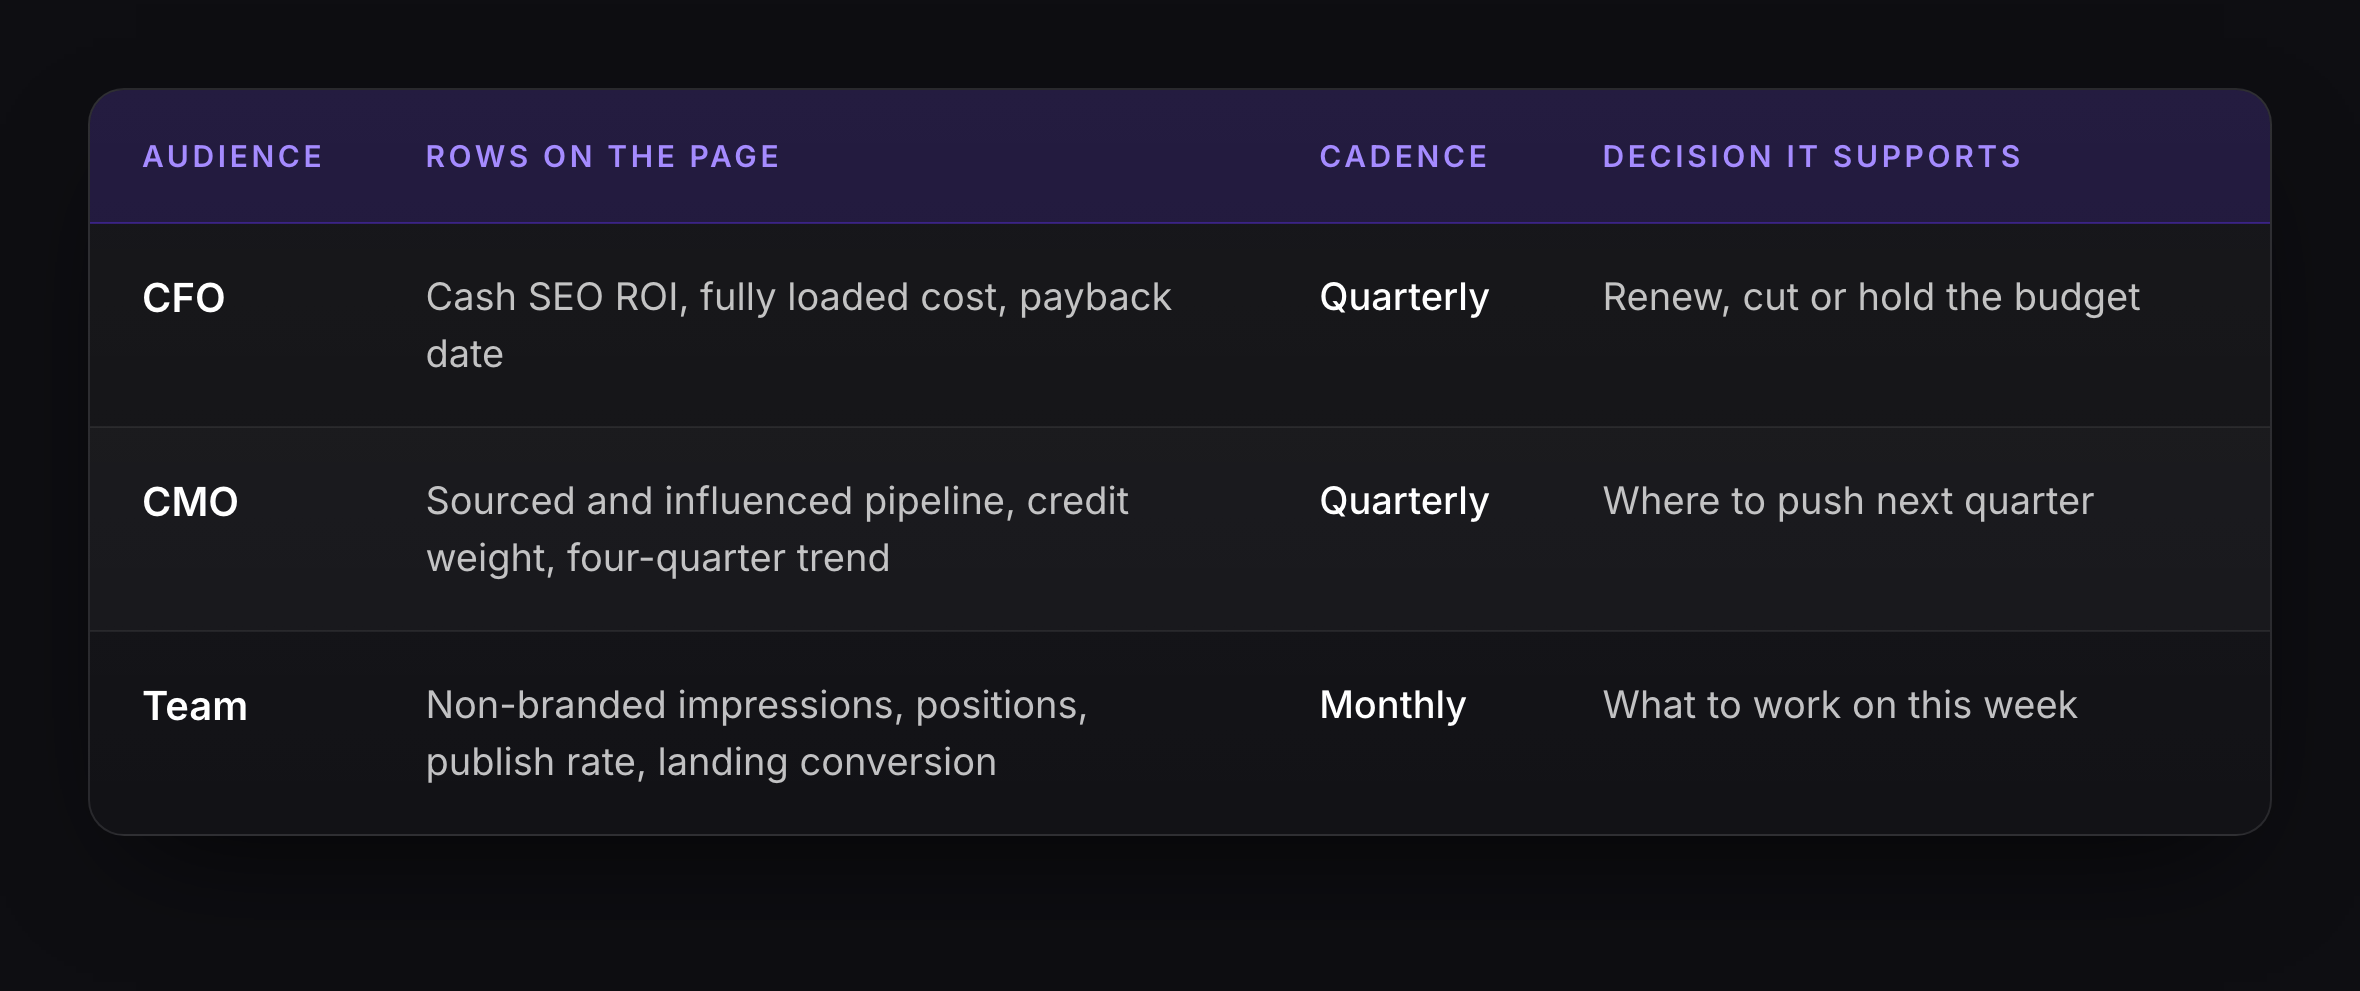
Why quarterly, not monthly. A monthly SEO ROI figure on a long sales cycle is mostly noise. One large deal closing a week early moves it by more than a quarter of genuine program improvement does. Reporting SEO ROI monthly trains everyone in the room to react to variance, and the reaction is usually to cut something that was working.
One rule for the page: every SEO ROI number on it carries its basis in the same line: cash or booked, sourced or influenced, branded included or stripped. A figure without its basis attached will be compared against a figure with a different one, and the comparison will be wrong.
When Not to Calculate SEO ROI at All
Three situations where the number will mislead whoever reads it.
Before product-market fit. If the ideal customer profile is still moving, the organic traffic acquired this quarter will not convert like the traffic acquired next quarter. The ROI figure measures a funnel that no longer exists by the time it is reported.
Inside the first two quarters. A program that has not yet indexed, ranked and accumulated a cohort has no revenue to divide by its cost. The honest answer at month four is a leading-indicator report covering rankings, non-branded impressions and assisted pipeline, not a return.
Where the baseline cannot be established. If organic was never measured before the program started, there is no floor, and every conversion gets credited to work that may not have caused it. Fix the measurement first and report the return a quarter later.
Where the program is one of four channels changing at once. If paid spend doubled, a new sales team started and pricing changed in the same two quarters, the SEO ROI you calculate is measuring all four. Attribution will still produce a number. It will be a number about the quarter, not about the program.
Saying "not yet, and here is what I will report instead" is a stronger position than producing an SEO ROI that collapses under the first serious question. Nobody has ever lost a budget by explaining which measurement is not yet available. Budgets are lost when a confident figure turns out to have been built on a lookback window shorter than the sales cycle.
The corollary is that the source fields, the branded split and the closed-won join are worth building a quarter or two before anyone asks for the SEO ROI figure. It is cheap to build early and nearly impossible to reconstruct retroactively, because the sessions that created this quarter's revenue happened before the tracking existed.
What to Do with The Number
Rebuild your SEO ROI on a profit basis, with the cost side fully loaded and branded search separated out. Report it two ways, cash collected and booked lifetime value, and label which is which before anyone asks.
Then watch the trend rather than the absolute. A program moving from −7% to 27% over four quarters is telling you something that no single benchmark, however widely cited, can. The absolute SEO ROI of any one quarter depends on choices you made about margin, attribution and window. The direction across four of them does not.
And when someone brings a benchmark to the meeting, ask the two questions this article has been building toward: what margin does it assume, and which break-even is it measuring? An SEO ROI figure that cannot answer both is a marketing claim, whoever published it.
If you want the arithmetic without building the model, our SEO ROI calculator runs the cost and attribution inputs described here. If the harder question is whether organic deserves the budget at all against paid, the SEO vs PPC budget advisor frames that comparison. And if the measurement problem is really a strategy problem, that is the subject of what companies get wrong about B2B SaaS SEO.
For companies where organic search is a material acquisition channel, the same discipline applies to the program itself. See our approach to B2B SaaS SEO.
FAQs
How do you calculate SEO ROI for SaaS?
SEO ROI for SaaS is net profit from organic search divided by the fully loaded cost of the program, expressed as a percentage. Attribute closed revenue to organic touchpoints across the whole sales cycle, apply gross margin so you are dividing profit rather than revenue, then divide by every cost the program consumed: agency fees, salaries, content production, technical work and tooling.
What is a good SEO ROI for a SaaS company?
There is no reliable published benchmark, and the most-cited one deserves scrutiny. First Page Sage reports 702% for B2B SaaS over three years, drawn from its own client campaigns run between 2021 and 2025, and that figure only reconciles with its companion ROAS of 8.75 at roughly a 92% profit margin. Judge your program against your paid channels and your cost of capital instead.
How long does SaaS SEO take to show a return?
It depends which break-even you mean, and the two differ by quarters. Booked lifetime value can cross program spend well inside the first year, which is what most published payback figures report. Cash collected against cash spent trails it, because lifetime value arrives over the customer's lifetime while the agency invoices monthly. Report both and label which is which.
What is the difference between organic-sourced and organic-influenced pipeline?
Sourced pipeline is where organic search was the first recorded touch. Influenced pipeline is any deal where organic appeared anywhere in the buying journey. In B2B SaaS the gap between them is wide, because a six to eighteen month cycle collects many touches. Reporting only sourced understates organic's contribution; reporting only influenced overstates it. Publish both, with the overlap shown.
What costs belong in an SEO ROI calculation?
Every cost the program consumes, not just the invoice: agency or consultant fees, in-house salaries for the people producing and reviewing the work, content production, technical implementation, and SEO tooling. Exclude costs the business carries regardless, such as general site hosting. The test is whether the cost would fall if the program stopped, which is the same test that governs customer acquisition cost.