


How to Calculate Total Addressable Market: A Practical Guide
Table of Contents
The formula for total addressable market fits on one line. Qualified accounts multiplied by annual revenue per account. A competent analyst can write that TAM formula from memory, and most guides stop roughly there, which is why so many people finish reading one and still cannot produce a TAM for their own business.
The difficulty in any TAM calculation was never the arithmetic. It sits entirely inside those two inputs. Where does the account count come from, and which revenue figure is honest. Everything that makes a total addressable market defensible or worthless happens before the multiplication sign.
This guide walks the TAM calculation end to end: the three TAM methods and when each applies, where the underlying data actually comes from, a worked B2B example with real arithmetic, and the reconciliation step that turns a TAM from a claim into a range you can defend. Each step below is where a TAM is won or lost. For the strategic question of what to do with the number once you have it, our companion piece on total addressable market analysis picks up where this one ends.
What a total addressable market calculation is measuring
Before the method, the definition, because a surprising number of TAM disputes turn out to be definitional rather than mathematical.
Your total addressable market is the annual revenue you would earn if you captured every buyer in your category, with no competitors, no capacity constraints, and no friction. A TAM is a ceiling. It is not a forecast, it is not a target, and a TAM presented as either will be discounted by anyone reading it carefully.
Two narrower figures sit beneath the TAM. Serviceable addressable market, or SAM, is the portion your current product, pricing, and geography can legitimately serve. Serviceable obtainable market, or SOM, is what you could realistically win within a planning horizon. Most guides define all three TAM layers and calculate only the first. This one calculates all three, because a total addressable market without the two layers below it cannot support a plan.
The three TAM calculation methods, compared
There are three established TAM methods. The choice between them is not stylistic. It follows from what data exists in your category.
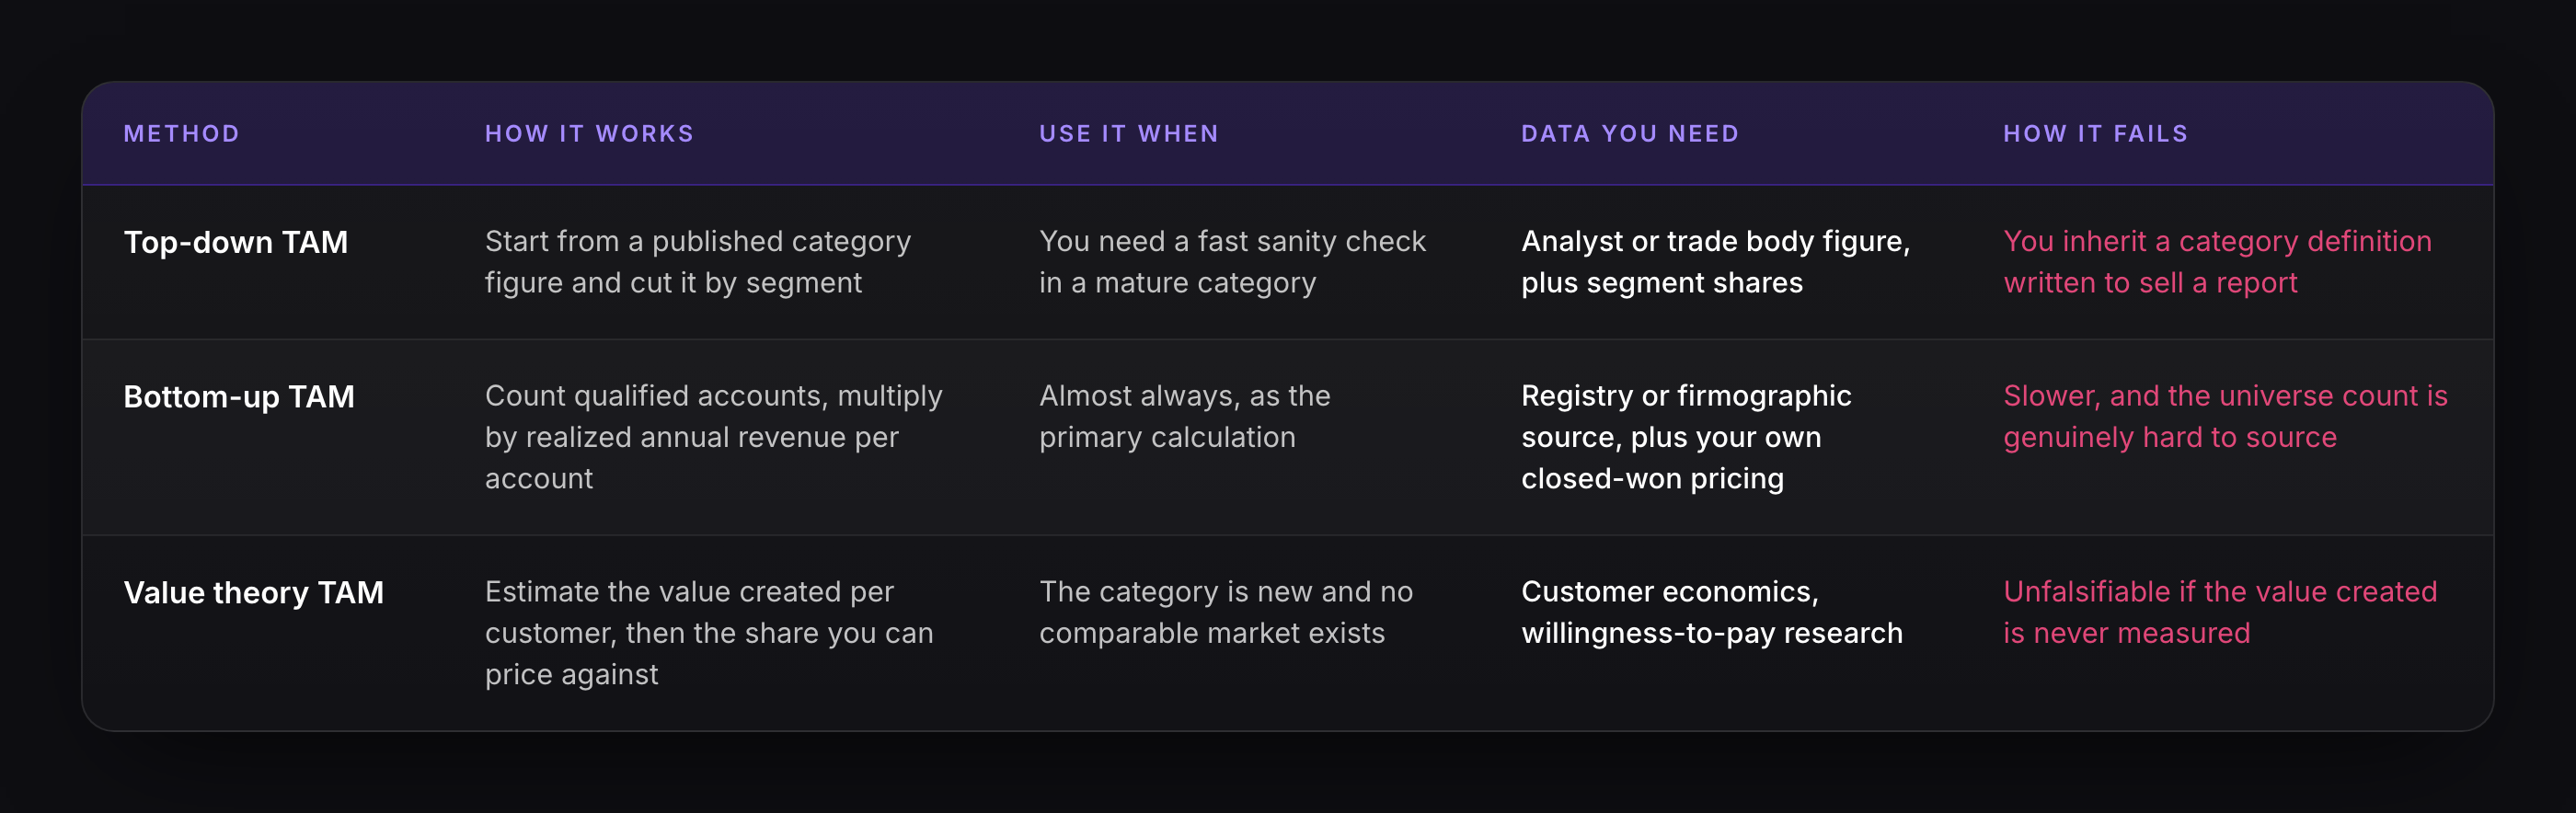
Bottom-up should be your primary TAM method in nearly every case. It is the only TAM method where a skeptic can challenge each input individually, and auditability is what a TAM is for. A top-down TAM is best used second, as a check rather than as an answer. Value theory TAM is a specialist tool for genuinely new categories.
Run at least two TAM methods. The gap between the two TAM figures is diagnostic information you cannot get any other way.
Step 1: Define the buying unit
The most common TAM error happens in the first five minutes of the calculation, when somebody writes down a segment that is not a buying unit.
"Mid-market manufacturers" is not a buying unit. It is a demographic. A buying unit is a specific entity with three properties: a budget line your product could come out of, a trigger that starts a purchase, and a person who can sign. If you cannot name all three, your TAM is counting entities that will never transact regardless of how good your product becomes.
The practical test is the unit mismatch check. Do you sell to organizations or to locations? A restaurant group with forty sites is one buying unit if procurement is centralized and forty if each manager buys independently. Getting this wrong moves a TAM by an order of magnitude, and it is the TAM error that survives longest, because nothing about the arithmetic looks wrong.
Step 2: Count the total addressable market universe from a source of record
This is the step every competing guide skips, and it is where most of the work in a total addressable market calculation actually sits.
A TAM that begins with a number someone else maintains can be recounted by a skeptic. A TAM that begins with an estimate cannot be checked at all, and an uncheckable TAM has no diligence value. In practice, the usable sources are narrower than people expect:
- Government registers and licensing boards. State professional licensing bodies, companies registers, and regulator lists. These are authoritative, free, and usually current.
- National statistical agencies. Business counts by industry code and employee band. Useful for the TAM denominator, too coarse for qualification on its own.
- Trade associations and membership rolls. Strong for fragmented professional categories where no licence is required.
- Firmographic databases. Faster than registries and easier to filter, but they carry coverage bias that you should state explicitly rather than absorb silently.
- Technographic and hiring signals. Install data and job postings qualify TAM accounts by whether they run a prerequisite system or employ the role that uses your product.
Whatever you use, record the source and the retrieval date next to every figure. A TAM with citations can be refreshed in an afternoon. A TAM without them has to be rebuilt from nothing every time it is questioned, which is the real reason so many of them go stale.
Step 3: Qualify the universe before you price it
The raw count is never your TAM. Apply the filters that genuinely gate a purchase, and be able to state the reason for each one in a sentence.
Useful filters are things like a headcount threshold below which the problem does not hurt enough, a revenue band that makes the price tolerable, a regulatory status that creates the requirement, or a prerequisite system your product attaches to. Each one narrows the total addressable market for a defensible reason.
One discipline matters here more than any other. Filters must be applied to disjoint attributes, or you will discount the same accounts twice. If you cut the universe by employee count and then again by revenue band, you have applied roughly the same filter twice, because the two correlate heavily. The result is a TAM that looks conservative and is simply wrong, which is the most flattering way a TAM can fail. Check that each successive filter removes accounts the previous one kept.
Step 4: Attach revenue per account
Use realized annual contract value, net of discounting, taken from your own closed-won data. Not list price. This single input decides more of your TAM than any other.
The distance between list and realized pricing in B2B is routinely fifteen to thirty percent, and it runs in one direction. A TAM built on list price is inflated by that margin before any other assumption in the total addressable market is tested. Where you have no sales history, comparable public pricing is acceptable, but say so, because it is the weakest input in the TAM.
Two mechanical cautions. Match the period: an annual account count multiplied by a monthly price produces a TAM twelve times too small, and this happens more often than it should. And decide whether expansion revenue belongs in your ACV. Including it in the TAM is defensible if your net revenue retention is stable and you say what you assumed. Including it silently is not. If you want to pressure-test the account economics underneath that figure, our SaaS LTV calculator runs the same inputs through to lifetime value.
Step 5: Reconcile the two total addressable market figures
Now run the second TAM method and compare the two.
If the bottom-up TAM and the top-down TAM land within about thirty percent of each other, you have a defensible TAM range and you should publish both numbers rather than picking the flattering one. If the two TAM figures diverge by three times or more, stop. You do not have a TAM arithmetic problem, you have a definition problem, and the two TAM methods are describing different markets. Finding out which definition is broken is worth more than the TAM itself.
Then write down the three assumptions that would damage the TAM most if they were wrong. This converts a TAM into a TAM plus a list of its own weaknesses, which is the only version that survives a serious diligence conversation.
A worked example, end to end
Take a workforce management platform selling to outpatient physical therapy clinics in the United States, and build its total addressable market from nothing. The figures below are illustrative, but the structure is exactly what a real TAM calculation looks like end to end.
Count the universe. State licensing rolls and the national trade association membership list give 26,000 clinic organizations.
Qualify it. The product only creates value at three or more locations, where scheduling across sites becomes the problem. 55 percent of organizations clear that threshold.
26,000 × 0.55 = 14,300 qualified accounts
Attach revenue per account. Realized ACV across the last eighteen months of closed-won deals, net of discount, is $18,600.
14,300 × $18,600 = $266M bottom-up total addressable market
Check the TAM top-down. A published figure for clinic management software globally is $4.1B. The US share is 38 percent, and outpatient physical therapy is roughly 19 percent of that.
$4.1B × 0.38 × 0.19 = $296M top-down TAM
The two TAM figures land 11 percent apart. That is a healthy spread, so the honest TAM output is a range of $266M to $296M, with average contract value named as the input that swings it most.
Then calculate the layers below the TAM. The company holds compliance coverage in 12 states, which contain 41 percent of qualified accounts.
14,300 × 0.41 = 5,863 accounts × $18,600 = $109M SAM
Sales capacity is nine account executives closing about 14 new logos each per year.
9 × 14 = 126 wins × $18,600 = $2.3M in new ARR per year, roughly 6 percent of SAM over three years
That last figure is the one that should drive planning. The total addressable market justifies the category and the TAM range wins the board meeting. The SOM arithmetic tells you what the current team can actually reach, and the gap between them is the argument for changing something.
5 errors that corrupt a total addressable market calculation
These are arithmetic failures rather than strategic ones, which makes them harder to spot in a TAM review.
- List price instead of realized ACV. Inflates the TAM by the full discount rate.
- Unit mismatch. Counting locations while selling to organizations, or the reverse.
- Correlated filters. Discounting the same TAM accounts twice through overlapping criteria.
- Period mismatch. Monthly pricing multiplied by an annual account count.
- Projected TAM presented as current. Applying a category growth rate to produce a future TAM, then citing it without the date attached.
How often to rebuild your total addressable market
A total addressable market moves with pricing, regulation, substitutes, and your own product scope, so no TAM is a permanent number. Annual is the minimum defensible cadence for rebuilding a TAM.
Rebuild the TAM sooner when any of its load-bearing inputs change: a pricing revision, entry into a new geography, a regulatory change that creates or removes a requirement, or a product release that moves the qualification threshold. If your TAM has not changed in two years while your price has, the number is stale by definition.
This is also where the limits of the exercise become clear. A TAM counts every account that could ever buy, including those that will not consider your category for years. A TAM says nothing about timing, which is why a growth program planned against a total addressable market alone tends to stall. The companion piece on total addressable market analysis covers the in-market subset and what to do about it, and much of that work is what B2B SaaS SEO services are engaged to influence.
The number is the easy part
Most teams can produce a total addressable market in a morning. Far fewer can produce a TAM that survives an hour of questioning, and the difference has almost nothing to do with the mathematics.
If you want a useful test, take your current total addressable market and try to trace a single figure inside it back to a source with a date on it. If you can, the model is probably sound and worth refreshing. If you cannot, you do not have a total addressable market, you have a TAM-shaped estimate that has been repeated often enough to feel like one, and rebuilding it from a register upward will take less time than defending it again.
When that exercise points at the question of how much of the market is reachable this year rather than eventually, our SEO ROI calculator puts a number on the demand already in motion. And if you would rather work through the model with people who build them regularly, we are straightforward to reach.
FAQs
What is the formula for total addressable market?
The standard formula is qualified accounts multiplied by average annual revenue per account. The formula is trivial. The work is producing a defensible account count from a source of record and a realized ACV net of discounting, which is where the accuracy of any total addressable market is determined. Every serious dispute about a TAM is a dispute about one of those two inputs.
Should I use top-down or bottom-up to calculate TAM?
Use bottom-up as your primary total addressable market method, because every input can be challenged individually. Use a top-down TAM as a second pass to check it. Running both and reporting the spread is stronger than either alone, and a divergence beyond roughly three times signals that your segment definition is wrong rather than your arithmetic.
Where do you get the data to calculate a TAM?
Government registers, professional licensing boards, national statistical agencies, and trade association membership rolls are the most defensible total addressable market sources, because a reviewer can recount them. Firmographic and technographic databases are faster and better for qualification, but carry coverage bias you should disclose. Pricing should come from your own closed-won records wherever possible.
How do you calculate SAM and SOM from TAM?
SAM is the total addressable market filtered to what your current product, pricing, and geography can serve, calculated by applying those constraints to the qualified TAM account count. SOM comes from capacity rather than from market data: multiply your realistic annual win count by ACV. SOM is the only one of the three total addressable market layers that a sales plan can be built against.
How often should you recalculate your TAM?
Recalculate your total addressable market annually at minimum, and immediately after any change to pricing, geography, regulation, or the qualification threshold your product implies. A TAM that has stayed constant while the business changed around it is not stable, it is simply out of date.