

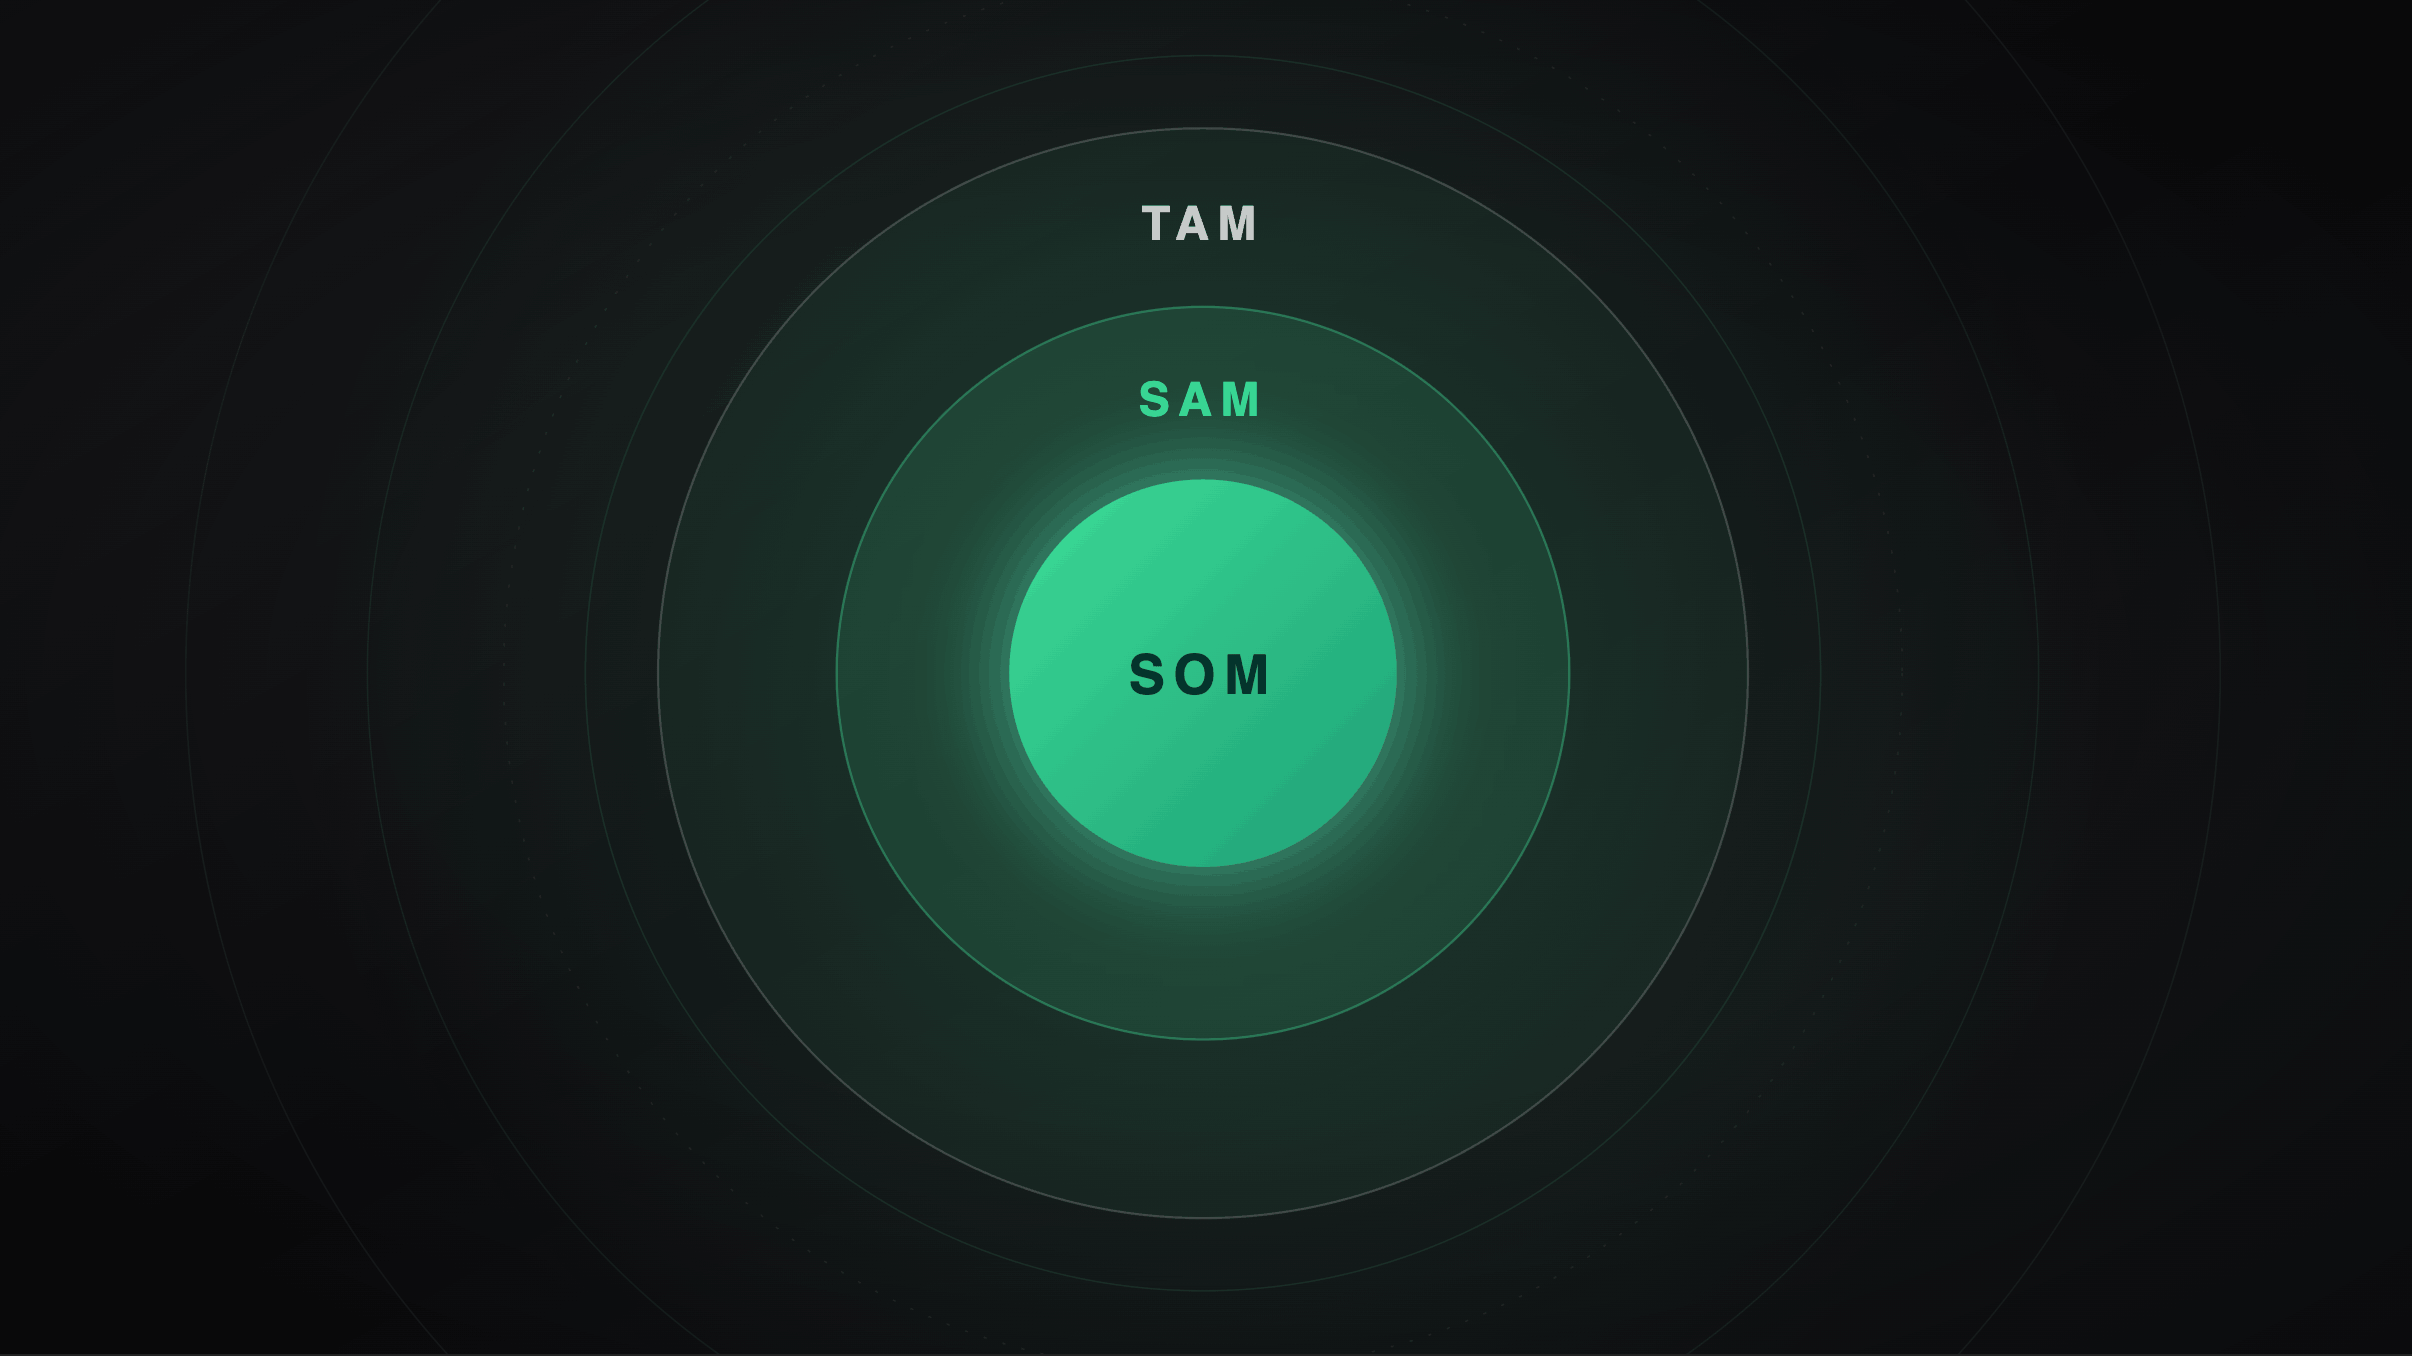
Total Addressable Market Analysis: The Number Everyone Cites and Almost Nobody Can Act On
Table of Contents
Sit through enough board meetings and you start to recognize slide four. Three nested circles, a figure with a "B" after it, and a room of intelligent people nodding at a number not one of them could reproduce from memory. That figure is the total addressable market, and it is arguably the most cited and least interrogated input in modern strategy.
The problem is not that total addressable market analysis is dishonest. Most of it is done carefully, by people who know the arithmetic. The problem is that it stops one step short of being useful. A total addressable market describes the size of the room. It says nothing about which door you can reach, who is already standing in front of it, or what it costs to cross the floor. Boards approve budgets against the room. Operators have to work the floor.
That gap, between a total addressable market that justifies the plan and a market map that directs it, is where most growth programs quietly fail.
What a Total Addressable Market Actually Measures
The definition is not in dispute. Your total addressable market is the total annual revenue available if you captured 100% of demand for your category, with no competitors, no capacity limits, and no friction. It is a ceiling, not a forecast, and treating a total addressable market as a forecast is the original sin of the whole exercise.
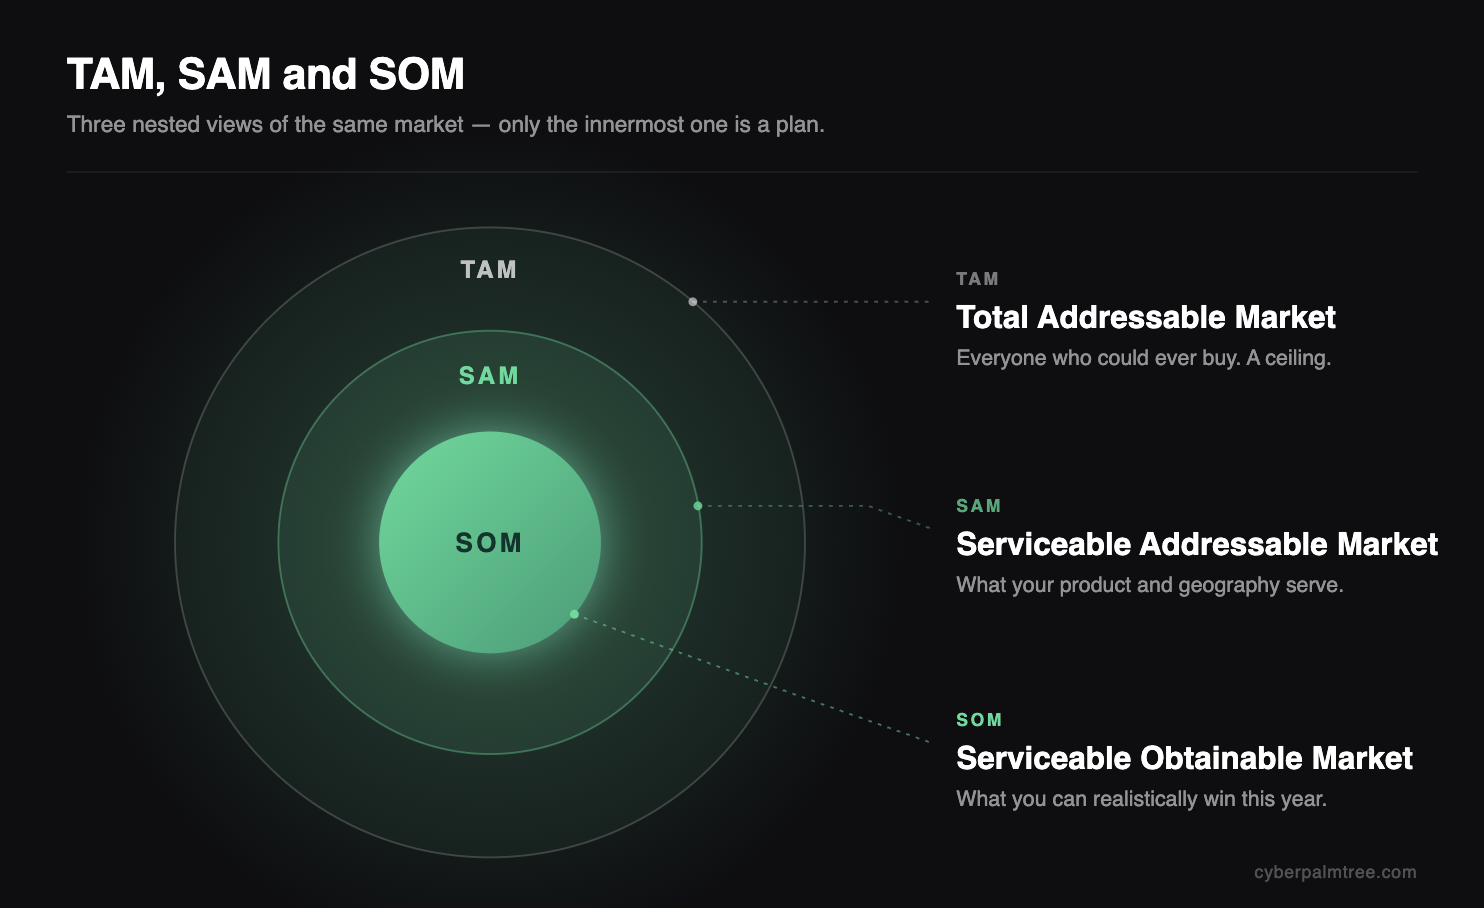
Beneath it sit two familiar narrower rings. Serviceable addressable market (SAM) is the slice of the total addressable market your current product, pricing, and geography can legitimately serve. Serviceable obtainable market (SOM) is what you can realistically win inside a planning horizon given your sales capacity and competitive position. Most operators can recite this hierarchy. Far fewer can explain which assumption inside their total addressable market is doing the heaviest lifting, and that is the question a good investor asks first.
3 Ways to Size a Total Addressable Market
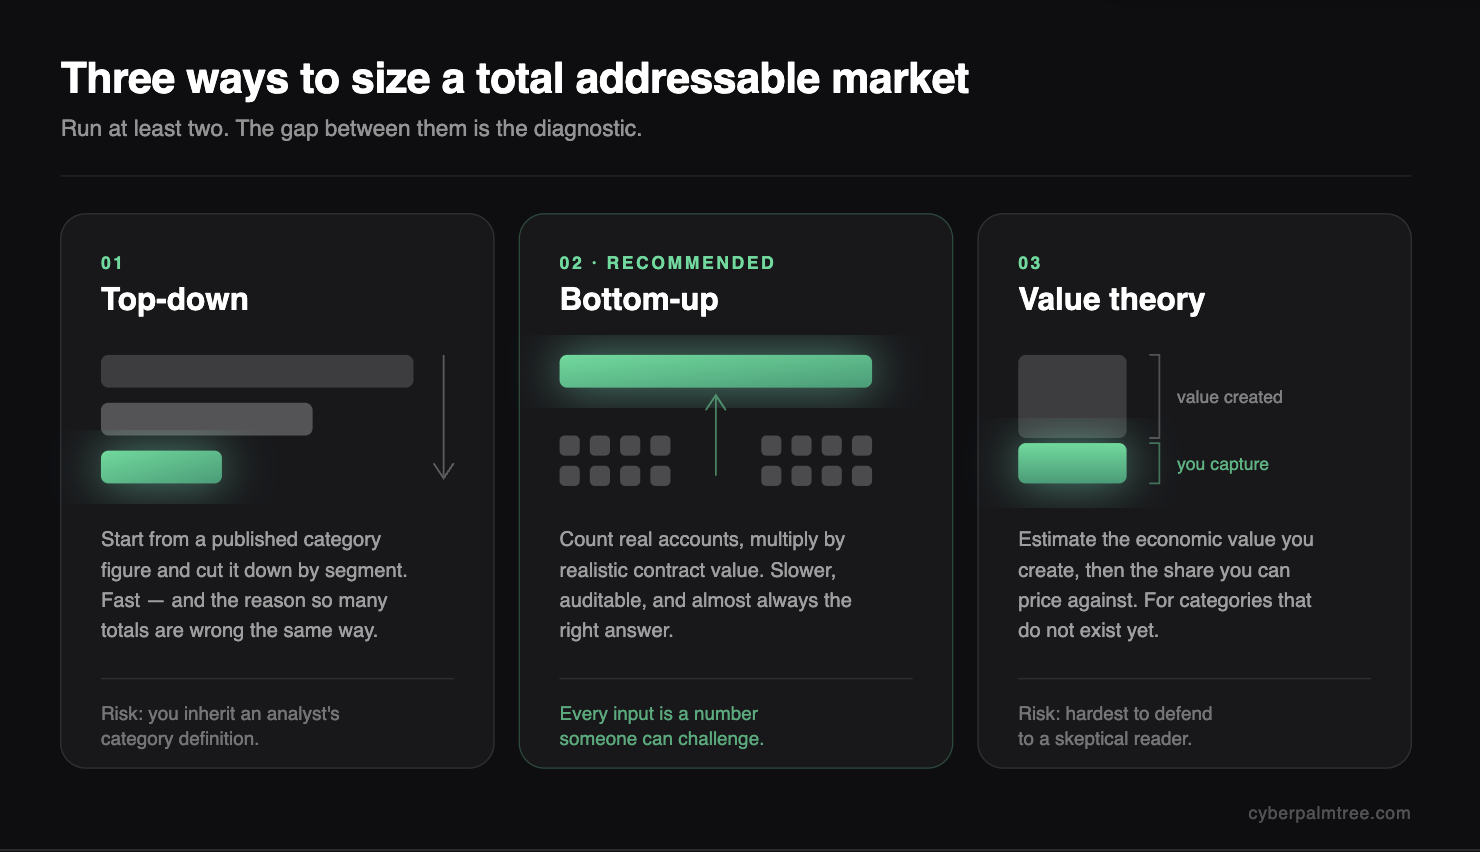
Top-down TAM Analysis Method
Start with a published industry figure and cut it by segment. It is fast, and it is the reason so many total addressable market numbers are wrong in the same direction. You inherit an analyst's category definition, which was written to sell a report, not to guide your roadmap.
Bottom-up TAM Analysis Method
Count the accounts that could plausibly buy, multiply by realistic annual contract value, and build the total addressable market from observable units. It is slower and almost always the right answer. A bottom-up total addressable market is auditable: every input is a number someone can challenge line by line.
Value Theory Approach
Estimate the economic value your product creates for a customer and the share of that value you can price against. This is the method for genuinely new categories, where no total addressable market exists yet because the category does not.
Serious total addressable market analysis runs at least two of these and treats the delta as a diagnostic. When a top-down and a bottom-up total addressable market land within roughly 30% of each other, you have a defensible range. When they diverge by 5x, one of your definitions is broken, and finding out which one is worth more than the total addressable market figure itself.
The Market Mapping Process That Makes the Number Defensible
A total addressable market is an output. The market mapping process is the work that earns it.
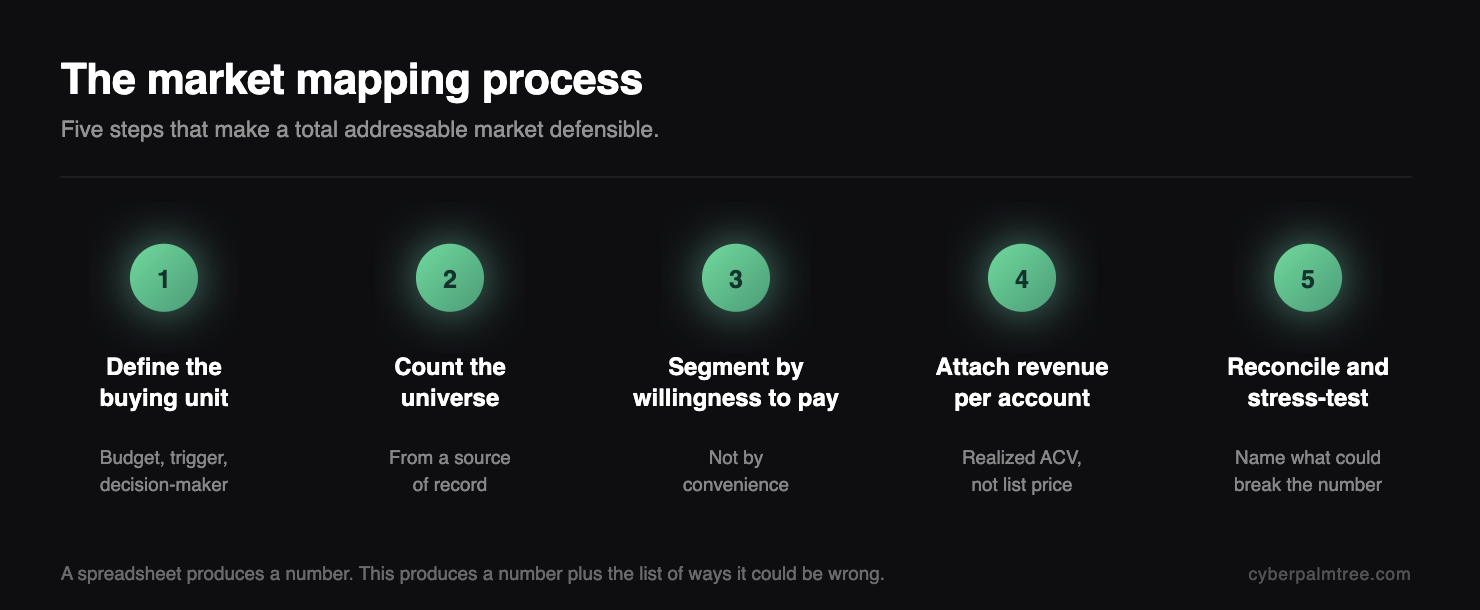
Five steps, in order:
- Define the buying unit. Not "SMBs." A specific entity with a budget, a trigger, and a decision-maker.
- Count the universe. Firmographic filters against a real source - registry data, licensing bodies, industry associations - not an estimate of an estimate.
- Segment by willingness to pay, not by convenience. Segments that share a price point belong together; segments that share an SIC code often do not.
- Attach revenue per account from your own closed-won data where it exists, and from comparable pricing where it does not.
- Reconcile top-down and bottom-up, then write down the three assumptions that would most damage the total addressable market if they were wrong.
That last step is what separates a market mapping process from a spreadsheet. Any total addressable market analysis can produce a number. A disciplined market mapping process produces a number plus a list of the ways it could be wrong, which is the only version that survives diligence.
How to Calculate a Total Addressable Market in Practice
The textbook formula is one line: qualified accounts multiplied by average annual revenue per account. Everything difficult about a total addressable market lives inside those two inputs, so build them in this order.
Start with a Source of Record, Not an Estimate
Count the universe from something someone else already maintains - a state licensing board, a companies register, an association membership roll. A total addressable market that begins with a registry can be re-counted by a skeptic; one that begins with "roughly 40,000 businesses" cannot.
Qualify The Universe Down Before You Price It
Apply the filters that actually gate a purchase: headcount, revenue band, geography, tech stack, regulatory status. Each filter narrows the total addressable market for a reason you can state in a sentence.
Price From Your Own Closed-won Data First
List price flatters a total addressable market. Realized average contract value, net of discounting, is the number that survives scrutiny. Use comparable public pricing only where you have no sales history.
Check It Top-down
Divide a published category figure by the same segment definition and see whether the two total addressable market totals agree.
A worked pass looks like this: 41,000 licensed firms in the register, 60% above the five-employee threshold that predicts a purchase, giving 24,600 qualified accounts; realized ACV of $9,400; a bottom-up total addressable market of roughly $231M. A top-down read of the same total addressable market lands at $280M. A 20% spread is a healthy range, and you publish both.
Where Total Addressable Market Data Actually Comes From
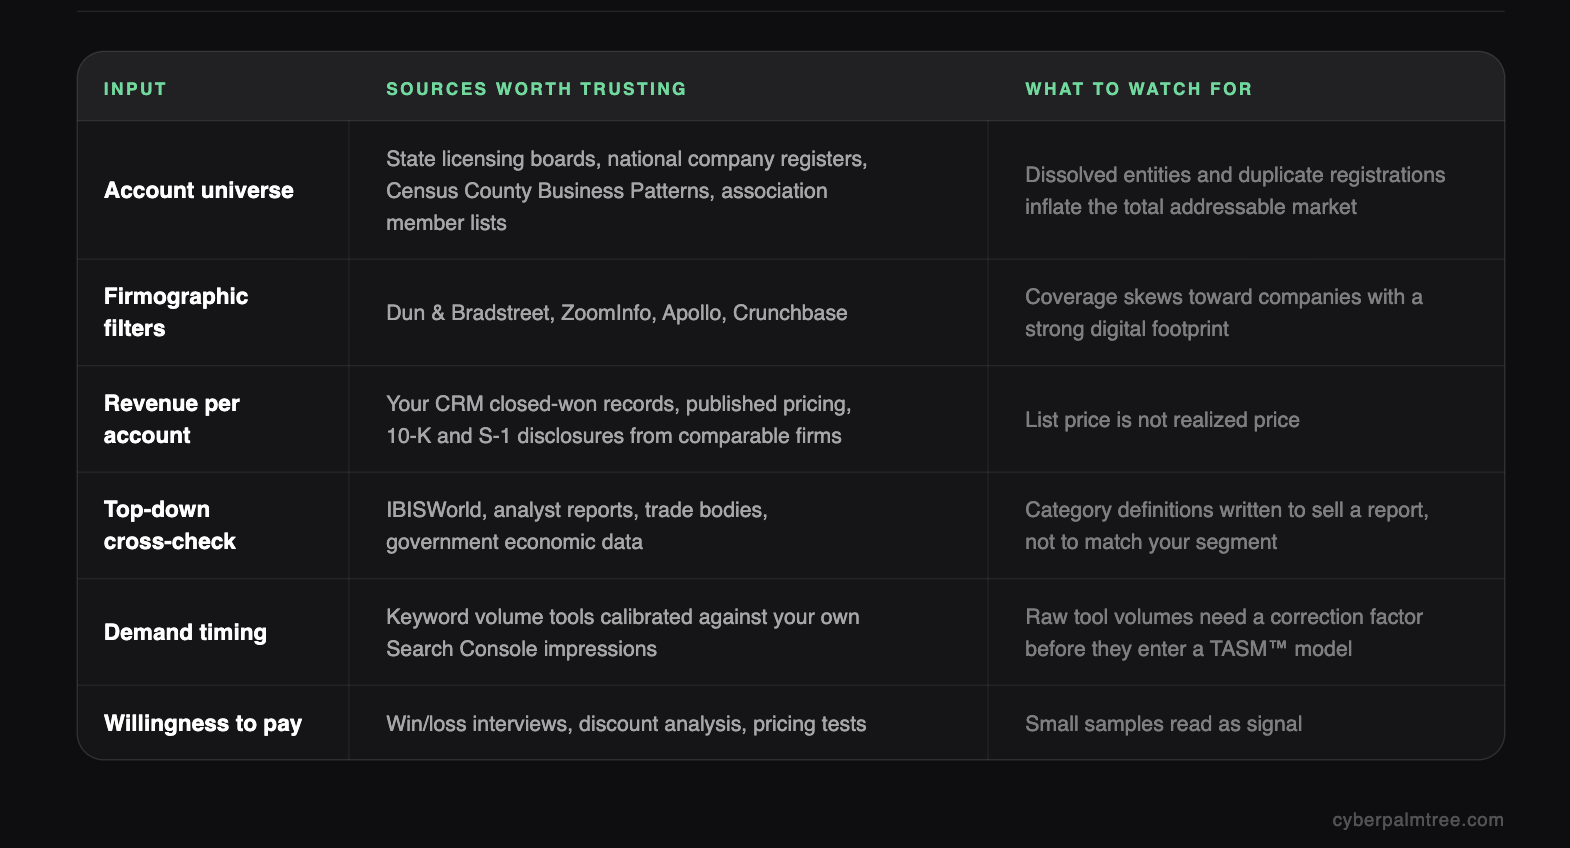
One discipline holds the whole thing together: log the source and retrieval date for every input. A total addressable market with citations can be updated in an afternoon. A total addressable market without them has to be rebuilt from scratch every time someone challenges it, which is why so many of them never get updated at all.
From Total Addressable Market to Total Addressable Search Market (TASM™)
Here is the uncomfortable part. Even a perfect total addressable market tells you nothing about timing. It counts every account that could ever buy, including the ones that will not think about your category for another six years. This is why a B2B SaaS growth program planned against a total addressable market alone tends to stall in its second quarter. You cannot run a quarter against a number like that.
What operators need is the in-market subset: the portion of the total addressable market actively expressing intent right now. We call that the total addressable search market, or TASM™ — the annual volume of commercial search demand across every query a buyer uses on the way to purchasing what you sell, converted into revenue at your own funnel rates.
TASM™ behaves differently from a total addressable market in three important ways. It is observable, because search volume is measured rather than modeled. It is contestable, because you can see exactly who currently captures it. And it is movable within a quarter, which no total addressable market ever is.
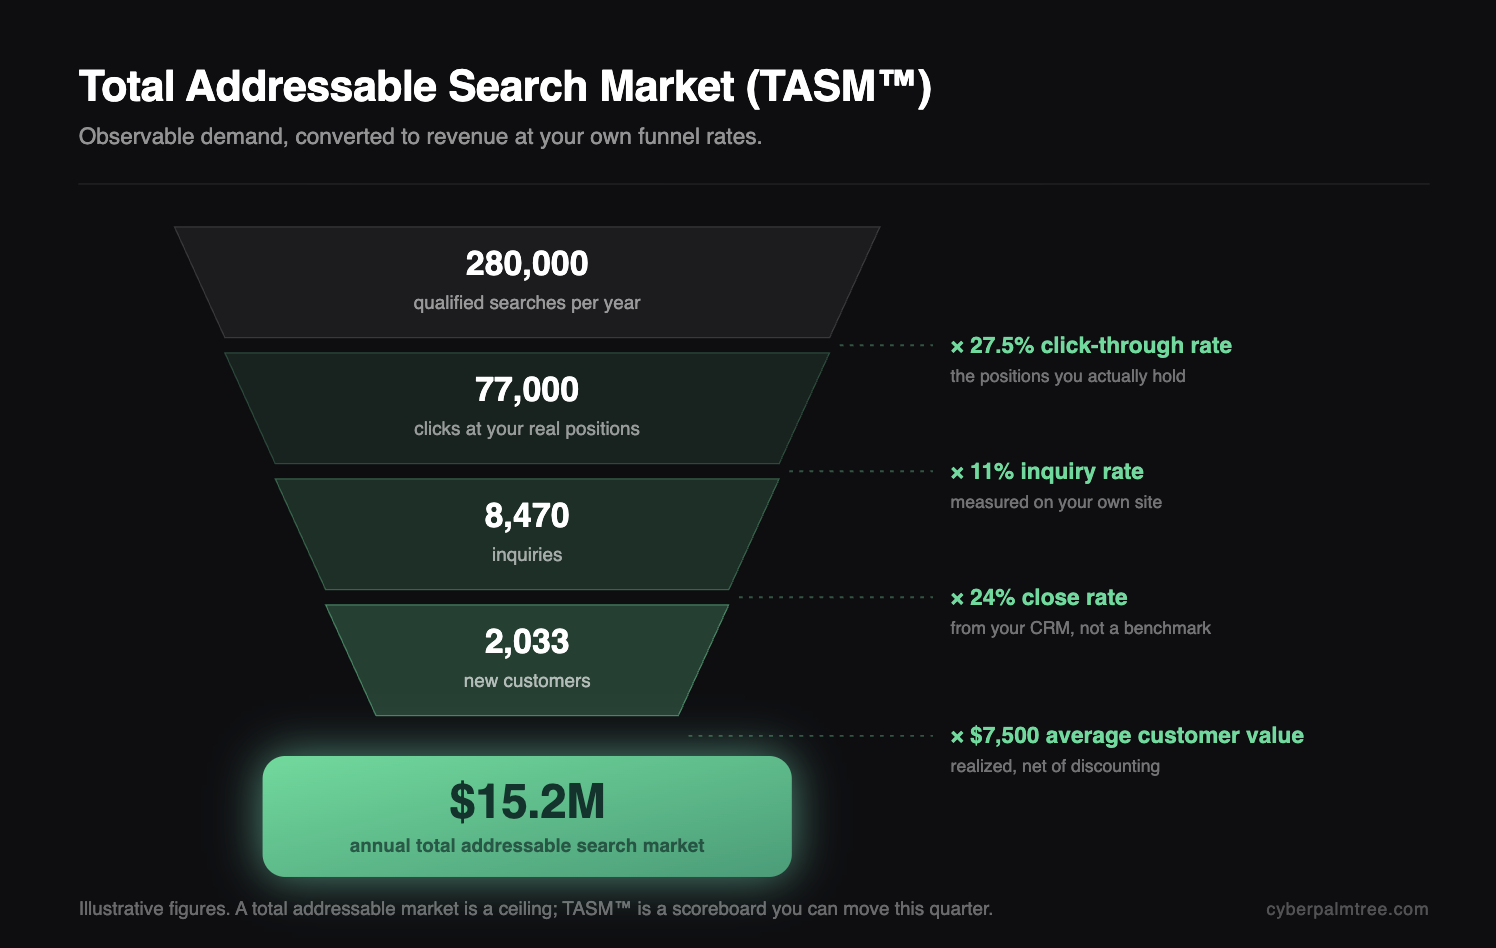
The arithmetic is unglamorous and that is the point. Take the qualified annual search volume in your category. Apply the click-through rate your positions actually earn. Apply your site's real inquiry rate, your close rate, and your average customer value. What comes out is not a ceiling but a scoreboard: the share of the total addressable search market you hold today, and the dollar value of one additional point of it. Boards fund a total addressable market. Teams execute against a total addressable search market.
What a Credible Total Addressable Market Analysis Should Produce
If your total addressable market analysis ends with a single figure, it is incomplete. Four outputs make it operational:
- A range, with the driver named. "$180M–$240M, and the swing is average contract value."
- A reconciliation. How the top-down and bottom-up total addressable market estimates differ, and why.
- A reachable layer. SAM, SOM, and the TASM™ view of demand available this year.
- A share position. What percentage of the total addressable market you hold now, and what one point is worth in revenue.
A total addressable market analysis that delivers all four stops being a fundraising artifact and starts being a planning instrument.
Where Total Addressable Market Analysis Goes Wrong
Three failure modes account for most of the damage.
Category inflation. Widening the definition until the total addressable market looks impressive. Every sophisticated reader discounts an inflated total addressable market, so the tactic costs credibility and buys nothing.
Double counting channels. Adding paid, organic, and marketplace demand as if they were separate buyers. They frequently are the same buyer at different moments, and a total addressable market built this way overstates the opportunity by design.
Setting it and forgetting it. A total addressable market moves with pricing, regulation, and substitutes. Reviewing it annually is the minimum; reviewing the total addressable search market quarterly is closer to right.
Turn the Number Into a Position
A total addressable market you cannot act on is a decoration. If you want to know the real size of your category, the share you hold today, and what a single point of that share is worth in revenue, that is exactly what our market mapping process and TASM™ model are built to produce.
Request a market capture assessment — we will size your total addressable market, map the demand already in motion, and show you the fastest points of share available to you.
FAQs
What is meant by total addressable market?
Total addressable market is the total annual revenue you would earn if you captured 100% of demand in your category, with no competition or capacity limits. A total addressable market is a ceiling used to judge whether an opportunity is worth pursuing, never a revenue projection.
How do you calculate total addressable market?
The most defensible method is bottom-up: multiply the number of qualified potential accounts by realistic annual revenue per account. Validate that total addressable market against a top-down estimate from industry data. If the two total addressable market figures diverge sharply, your segment definition is the likely culprit.
What is the difference between TAM, SAM, and SOM?
Total addressable market is everyone who could ever buy. SAM is the portion your current product and geography can serve. SOM is what you can realistically win this year. A rigorous market mapping process produces all three, because a total addressable market alone cannot support a plan.
What is a good total addressable market for a startup?
Large enough to build a durable business, narrow enough that you can credibly lead a segment of it. Investors are more persuaded by a modest total addressable market with verifiable inputs than by a vast one built on assumptions, which is the same logic that drives valuation multiples at exit, so the quality of the market mapping process matters more than the size of the number.
How is total addressable search market (TASM™) different from TAM?
A total addressable market counts every possible buyer, including those years from purchasing. The total addressable search market counts only the demand actively searching now, converted to revenue at your funnel rates. TASM™ is the fraction of the total addressable market you can compete for this quarter, which is why it is the number operators plan against.